
How to Track Your ChatGPT and Codex Usage with the New Usage Data API: Complete Developer Integration Guide
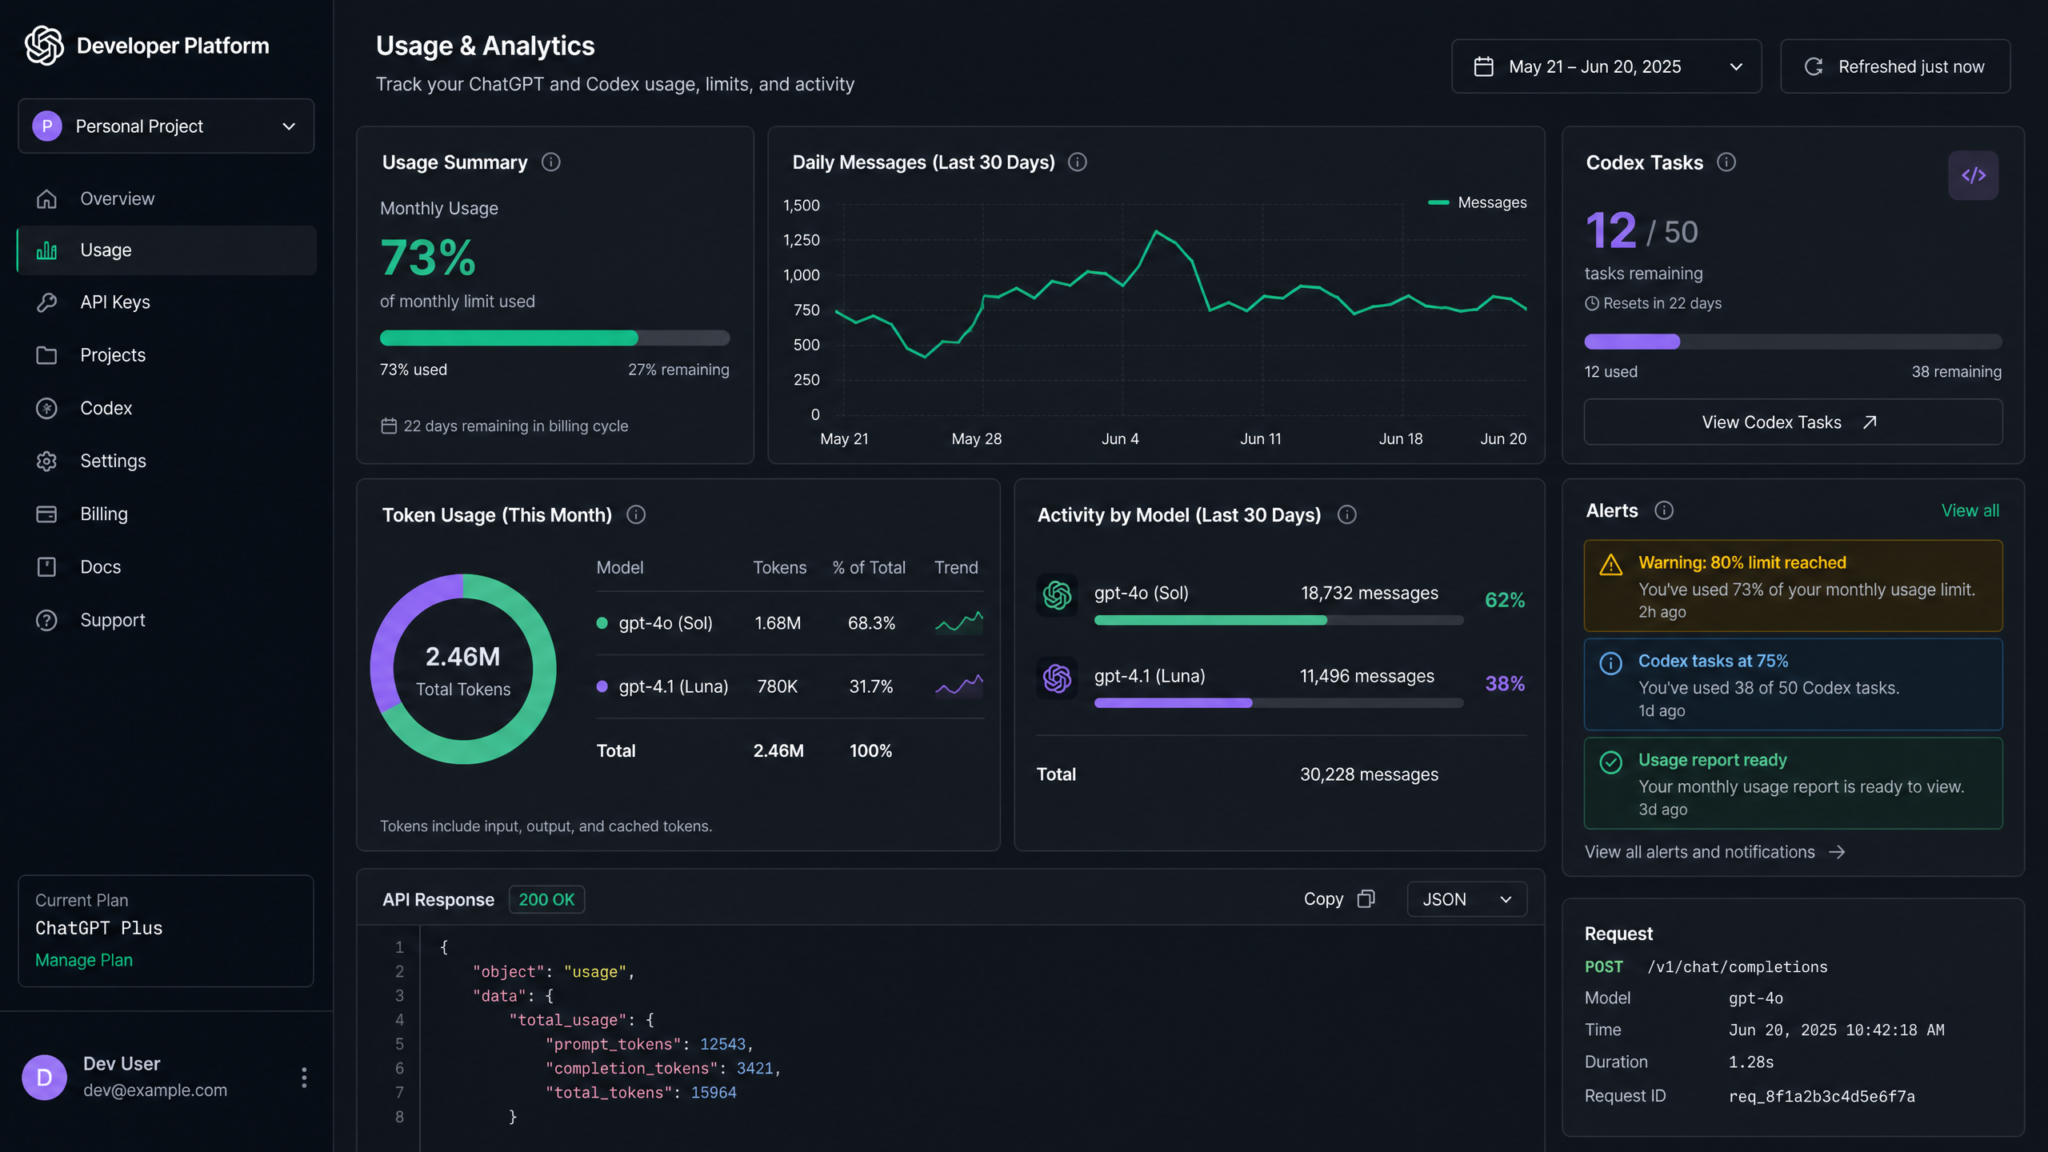
Managing AI costs has become one of the most pressing operational challenges for engineering teams in 2024. With OpenAI’s Usage Data API now providing programmatic access to granular consumption data — covering message counts, token throughput, Codex task execution, allowance balances, and billing cycle resets — developers finally have the infrastructure to build serious usage monitoring pipelines. Whether you’re running a startup burning through API credits or a Fortune 500 engineering department managing dozens of team members, understanding exactly how your ChatGPT and Codex consumption breaks down in real time is the difference between controlled, predictable AI infrastructure costs and monthly budget surprises that derail engineering roadmaps. This guide walks you through every layer of the integration: from authenticating your first API call to deploying a full-stack React dashboard with predictive limit warnings, Slack alerts, and department-level chargeback reports.
Step 1: Understanding the Usage Data API
Before writing a single line of integration code, you need a precise mental model of what the Usage Data API exposes and why each data point matters for operational decision-making. The API operates as a read-only reporting layer on top of your OpenAI account’s consumption data. It does not control rate limits, modify quotas, or approve spending increases — it surfaces the information your engineering and finance teams need to make those decisions themselves.
Core Data Categories the API Exposes
The Usage Data API breaks consumption reporting into four primary domains:
1. Message Counts
For ChatGPT-family models (including GPT-4o, GPT-4 Turbo, and GPT-3.5 Turbo), the API tracks total messages sent within a billing window. This is particularly important for teams using the ChatGPT API in conversational products where a single user session might generate dozens of individual messages. Message counts are bucketed by model family, making it straightforward to compare GPT-4o consumption against cheaper alternatives.
2. Token Usage
Token-level granularity is where the real cost intelligence lives. The API exposes prompt tokens (everything sent in the input), completion tokens (everything generated in the output), and cached prompt tokens (which are billed at a reduced rate). For most production workloads, the prompt-to-completion ratio is a critical efficiency signal — a high prompt token count relative to completions often indicates that your system prompt architecture needs optimization. Token data is available at multiple granularities: lifetime totals, per-billing-cycle summaries, and daily breakdowns via the history endpoint.
3. Codex Task Counts
OpenAI’s Codex agent execution environment tracks usage differently from the chat completion API. Rather than billing purely on tokens, Codex bills on task executions — discrete agentic runs where the model takes actions, browses code, and produces artifacts. The Usage Data API exposes task count, average task duration in seconds, and the computational resources consumed per task. This data is accessible via a dedicated /v1/usage/codex endpoint distinct from the general usage summary.
4. Remaining Allowance and Reset Dates
Perhaps the most operationally critical data points are the remaining monthly allowance (expressed in both dollars and token equivalents) and the precise UTC timestamp of the next billing cycle reset. The reset date is returned as an ISO 8601 timestamp, allowing you to build accurate “days remaining in cycle” calculations and extrapolate whether current burn rates will exceed limits before the next reset.
API Architecture Overview
The Usage Data API follows standard REST conventions and returns JSON responses. All timestamps are UTC. Monetary values are expressed in USD cents as integers (to avoid floating-point precision issues). Token counts are standard 64-bit integers. The base URL for all usage endpoints is:
https://api.openai.com/v1/usageRate limits for the Usage Data API itself are intentionally generous — 120 requests per minute per organization — because OpenAI recognizes that usage polling is a legitimate background process. However, as you’ll learn in the caching section, polling at anywhere near that limit is both wasteful and architecturally unsound.
What the API Does Not Expose
Understanding the API’s boundaries is as important as understanding its capabilities. The Usage Data API does not expose per-request logs (individual API call payloads are not retrievable), real-time streaming token counts during active generations, or usage broken down by API key (only by organization and, where team features are enabled, by user). For per-key attribution, you’ll need to implement your own request tagging strategy, which the team monitoring section covers in depth.
Step 2: Authentication and Setup
The Usage Data API supports two authentication pathways: direct API key authentication for server-to-server integrations and OAuth 2.0 for applications where individual users are authorizing access to their own usage data. For most team monitoring dashboards, you’ll use API key authentication against your organization account. For user-facing tools where individuals want to inspect their own usage, OAuth 2.0 is the appropriate pattern.
API Key Authentication
Generate a usage-scoped API key from your OpenAI Platform dashboard under API Keys → Create New Key. When creating the key, select the usage:read scope. Avoid using your primary completions API key for usage monitoring — principle of least privilege means your monitoring infrastructure should use keys that cannot accidentally trigger model calls if misconfigured.
# Python: Basic API key setup
import os
import httpx

OPENAI_API_KEY = os.environ["OPENAI_USAGE_API_KEY"]
BASE_URL = "https://api.openai.com/v1/usage"

headers = {
    "Authorization": f"Bearer {OPENAI_API_KEY}",
    "Content-Type": "application/json",
    "OpenAI-Organization": os.environ["OPENAI_ORG_ID"]  # Required for team accounts
}

async def get_usage_summary():
    async with httpx.AsyncClient() as client:
        response = await client.get(
            f"{BASE_URL}/summary",
            headers=headers
        )
        response.raise_for_status()
        return response.json()
OAuth 2.0 Flow for User-Delegated Access
If you’re building a tool that lets individual developers authorize access to their own OpenAI usage data, implement the standard Authorization Code flow. The required scopes are usage:read for basic consumption data and usage:history:read for historical breakdown access. Here’s the complete OAuth flow implementation in Python using the authlib library:
from authlib.integrations.httpx_client import AsyncOAuth2Client

CLIENT_ID = os.environ["OPENAI_OAUTH_CLIENT_ID"]
CLIENT_SECRET = os.environ["OPENAI_OAUTH_CLIENT_SECRET"]
REDIRECT_URI = "https://yourproject.io/auth/callback"

AUTHORIZATION_ENDPOINT = "https://auth.openai.com/oauth/authorize"
TOKEN_ENDPOINT = "https://auth.openai.com/oauth/token"

async def get_authorization_url():
    client = AsyncOAuth2Client(
        client_id=CLIENT_ID,
        client_secret=CLIENT_SECRET,
        redirect_uri=REDIRECT_URI,
        scope="usage:read usage:history:read"
    )
    uri, state = client.create_authorization_url(AUTHORIZATION_ENDPOINT)
    return uri, state

async def exchange_code_for_token(code: str, state: str):
    client = AsyncOAuth2Client(
        client_id=CLIENT_ID,
        client_secret=CLIENT_SECRET,
        redirect_uri=REDIRECT_URI
    )
    token = await client.fetch_token(
        TOKEN_ENDPOINT,
        code=code,
        state=state
    )
    return token
Required Environment Variables
Maintain a clean separation between credentials for different environments. Here’s the recommended .env structure for a production usage monitoring service:
# .env configuration for yourproject.io usage monitor
OPENAI_USAGE_API_KEY=sk-usage-...
OPENAI_ORG_ID=org-...
OPENAI_OAUTH_CLIENT_ID=client-...
OPENAI_OAUTH_CLIENT_SECRET=secret-...
USAGE_WEBHOOK_SECRET=whsec-...
ALERT_THRESHOLD_WARN=0.80
ALERT_THRESHOLD_CRITICAL=0.95
SLACK_WEBHOOK_URL=https://hooks.slack.com/services/...
Step 3: Querying Usage Endpoints
The Usage Data API exposes three primary endpoints, each serving a distinct reporting purpose. Understanding when to call each endpoint — and how to interpret the response schemas — is fundamental to building a reliable monitoring system.
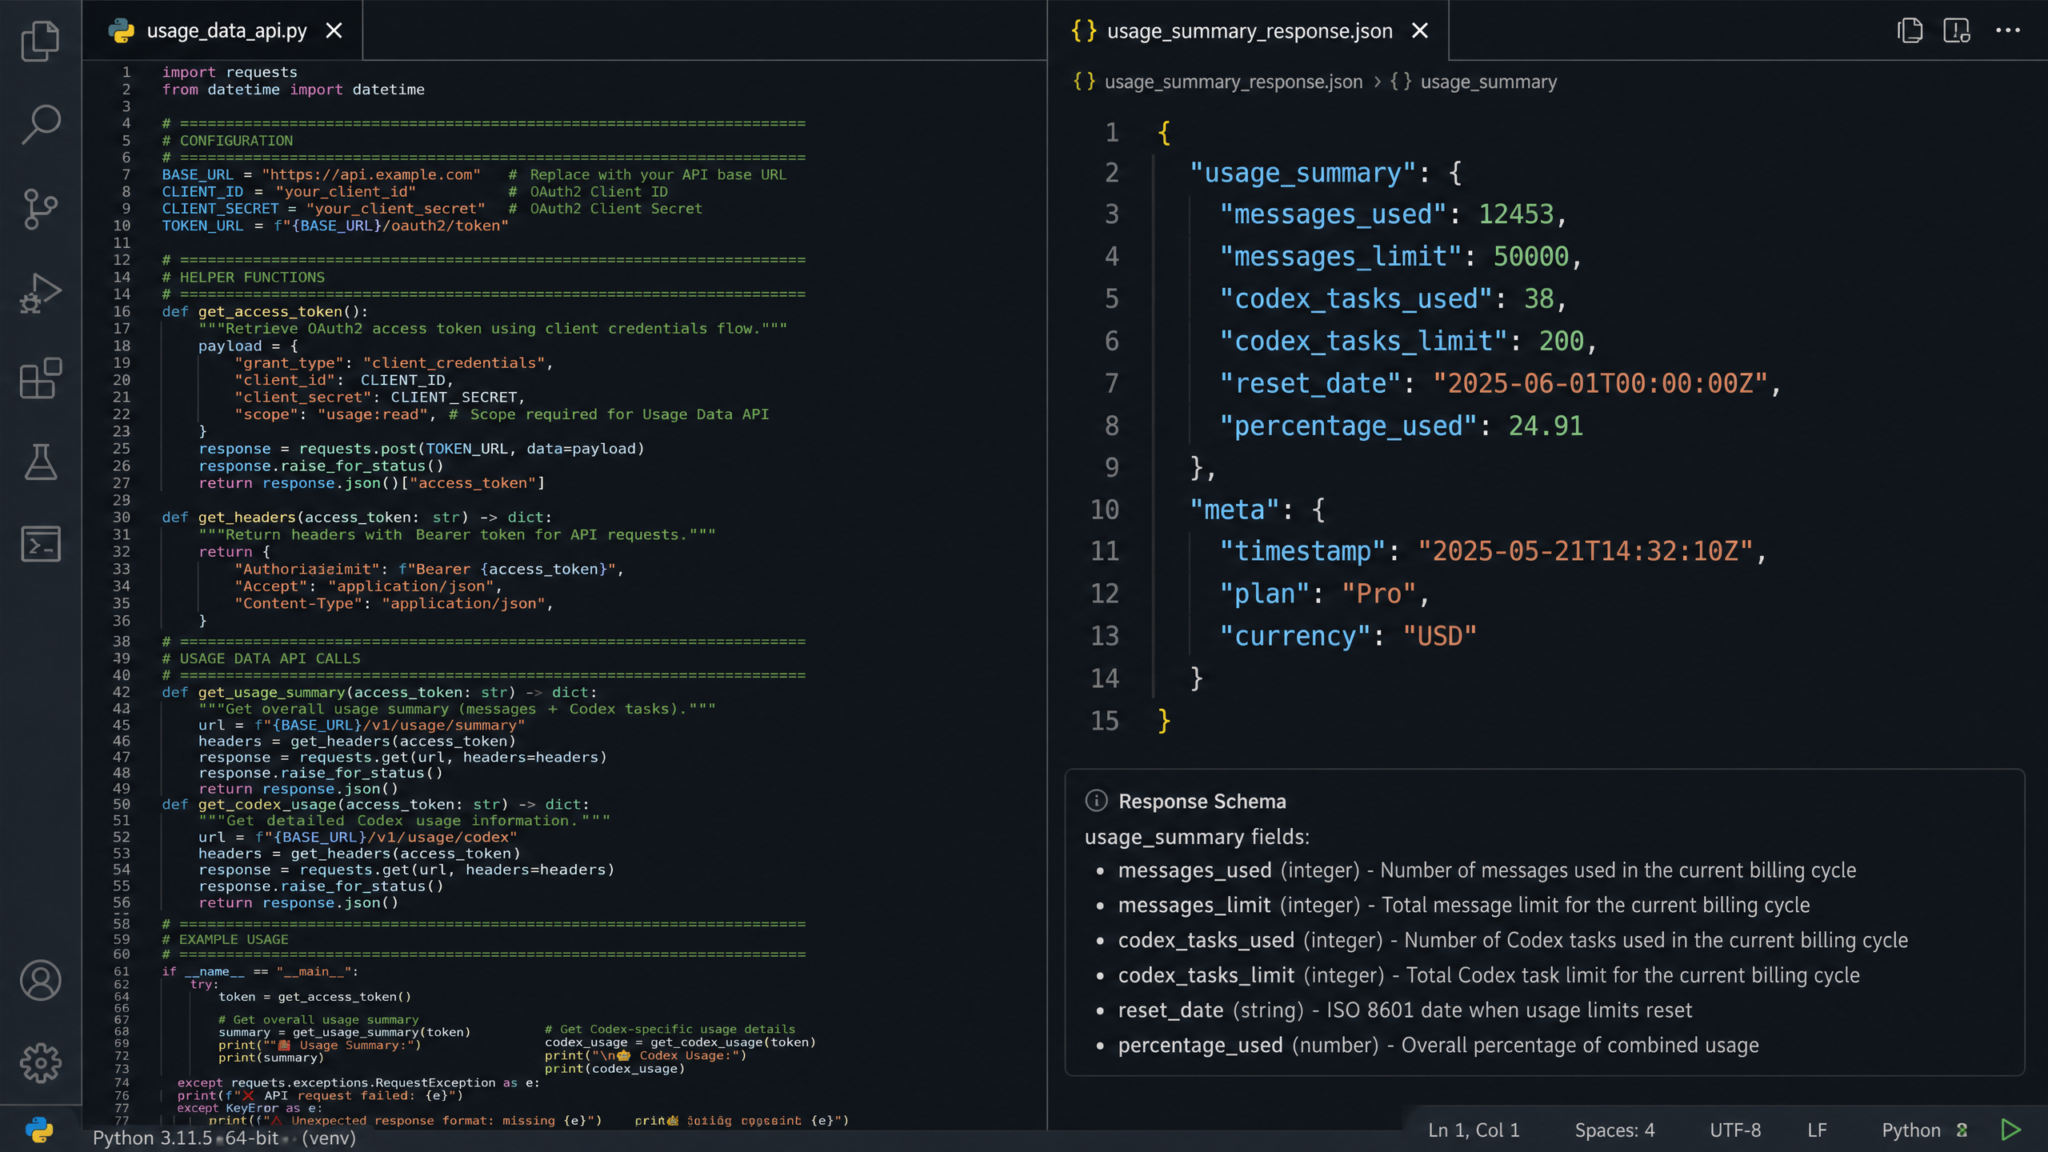
GET /v1/usage/summary
The summary endpoint returns a snapshot of current billing cycle consumption. Call this endpoint when you need the current state: how much has been consumed, how much remains, and when the cycle resets. It’s the right endpoint for dashboard header metrics and alert threshold calculations.
# Python: Query the summary endpoint
async def fetch_usage_summary(client: httpx.AsyncClient) -> dict:
    response = await client.get(
        "https://api.openai.com/v1/usage/summary",
        headers=headers
    )
    response.raise_for_status()
    return response.json()

# Example response structure
{
  "object": "usage.summary",
  "billing_cycle_start": "2024-11-01T00:00:00Z",
  "billing_cycle_end": "2024-12-01T00:00:00Z",
  "reset_at": "2024-12-01T00:00:00Z",
  "days_remaining": 12,
  "models": {
    "gpt-4o": {
      "prompt_tokens": 4820000,
      "completion_tokens": 1240000,
      "cached_prompt_tokens": 890000,
      "total_tokens": 6060000,
      "message_count": 18420,
      "cost_usd_cents": 18540
    },
    "gpt-4-turbo": {
      "prompt_tokens": 1200000,
      "completion_tokens": 320000,
      "cached_prompt_tokens": 0,
      "total_tokens": 1520000,
      "message_count": 4200,
      "cost_usd_cents": 4980
    },
    "gpt-3.5-turbo": {
      "prompt_tokens": 12400000,
      "completion_tokens": 3800000,
      "cached_prompt_tokens": 2100000,
      "total_tokens": 16200000,
      "message_count": 89400,
      "cost_usd_cents": 3240
    }
  },
  "allowance": {
    "total_usd_cents": 50000,
    "consumed_usd_cents": 26760,
    "remaining_usd_cents": 23240,
    "utilization_percentage": 53.52
  }
}
GET /v1/usage/history
The history endpoint returns daily usage breakdowns for a specified date range. It accepts start_date and end_date query parameters in YYYY-MM-DD format and an optional model filter. This is your source of truth for trend analysis, chart rendering, and burn rate calculations.
# JavaScript: Query the history endpoint with date range
async function fetchUsageHistory(startDate, endDate, model = null) {
  const params = new URLSearchParams({
    start_date: startDate,
    end_date: endDate,
    ...(model && { model })
  });

  const response = await fetch(
    `https://api.openai.com/v1/usage/history?${params}`,
    {
      headers: {
        'Authorization': `Bearer ${process.env.OPENAI_USAGE_API_KEY}`,
        'OpenAI-Organization': process.env.OPENAI_ORG_ID
      }
    }
  );

  if (!response.ok) {
    throw new Error(`Usage history fetch failed: ${response.status}`);
  }

  return response.json();
}

// Example response
{
  "object": "usage.history",
  "data": [
    {
      "date": "2024-11-18",
      "prompt_tokens": 284000,
      "completion_tokens": 76000,
      "total_tokens": 360000,
      "message_count": 1240,
      "cost_usd_cents": 1080,
      "models_breakdown": {
        "gpt-4o": { "tokens": 210000, "cost_usd_cents": 840 },
        "gpt-3.5-turbo": { "tokens": 150000, "cost_usd_cents": 240 }
      }
    }
  ],
  "has_more": false
}
GET /v1/usage/codex
Codex usage has its own dedicated endpoint because its billing model differs fundamentally from token-based completions. Tasks are the primary unit of measurement, with additional granularity around compute minutes consumed per task category.
# Python: Fetch Codex-specific usage
async def fetch_codex_usage(start_date: str, end_date: str) -> dict:
    async with httpx.AsyncClient() as client:
        response = await client.get(
            "https://api.openai.com/v1/usage/codex",
            params={"start_date": start_date, "end_date": end_date},
            headers=headers
        )
        response.raise_for_status()
        return response.json()

# Example response
{
  "object": "usage.codex",
  "billing_period": {
    "start": "2024-11-01T00:00:00Z",
    "end": "2024-12-01T00:00:00Z"
  },
  "tasks": {
    "total_count": 847,
    "completed": 821,
    "failed": 26,
    "average_duration_seconds": 34.2
  },
  "allowance": {
    "total_tasks": 1000,
    "consumed_tasks": 847,
    "remaining_tasks": 153,
    "utilization_percentage": 84.7
  },
  "compute": {
    "total_minutes": 483.2,
    "cost_usd_cents": 9664
  },
  "daily_breakdown": [
    {
      "date": "2024-11-18",
      "task_count": 42,
      "compute_minutes": 24.1,
      "cost_usd_cents": 482
    }
  ]
}
Step 4: Building a Usage Dashboard
A well-designed usage dashboard serves two audiences simultaneously: engineers who need technical granularity (token counts, model breakdowns, per-endpoint consumption) and stakeholders who need business-level summaries (cost trends, budget utilization, projected overages). The React implementation below serves both by layering a summary view over detailed drill-down components.
Dashboard Architecture
The dashboard is structured as a Next.js application with server-side data fetching, a Redis cache layer, and client-side React components for interactivity. The data flow is:
- API Route: Next.js API routes proxy usage API calls and apply caching
- SWR Hooks: Client-side data fetching with automatic revalidation
- Recharts: Chart rendering for historical trend visualization
- Alert Engine: Threshold evaluation runs on every summary fetch
Core Dashboard Component Structure
// components/UsageDashboard.tsx
import { useSWR } from 'swr';
import { UsageSummaryCard } from './UsageSummaryCard';
import { TokenHistoryChart } from './TokenHistoryChart';
import { ModelBreakdownTable } from './ModelBreakdownTable';
import { CodexUsagePanel } from './CodexUsagePanel';
import { BurnRatePredictor } from './BurnRatePredictor';

const fetcher = (url: string) => fetch(url).then(r => r.json());

export function UsageDashboard() {
  const { data: summary, error: summaryError } = useSWR(
    '/api/usage/summary',
    fetcher,
    { refreshInterval: 300000 } // Refresh every 5 minutes
  );

  const { data: history } = useSWR(
    '/api/usage/history?days=30',
    fetcher,
    { refreshInterval: 3600000 } // Refresh every hour
  );

  const { data: codex } = useSWR(
    '/api/usage/codex',
    fetcher,
    { refreshInterval: 300000 }
  );

  if (summaryError) return <ErrorState message="Failed to load usage data" />;
  if (!summary) return <LoadingSkeleton />;

  return (
    <div className="dashboard-grid">
      {/* Header row: Current cycle utilization */}
      <UsageSummaryCard
        consumed={summary.allowance.consumed_usd_cents}
        total={summary.allowance.total_usd_cents}
        remaining={summary.allowance.remaining_usd_cents}
        resetAt={summary.reset_at}
        daysRemaining={summary.days_remaining}
      />

      {/* Burn rate prediction */}
      <BurnRatePredictor
        history={history?.data || []}
        remaining={summary.allowance.remaining_usd_cents}
        daysRemaining={summary.days_remaining}
      />

      {/* 30-day token history chart */}
      <TokenHistoryChart data={history?.data || []} />

      {/* Per-model breakdown */}
      <ModelBreakdownTable models={summary.models} />

      {/* Codex task panel */}
      <CodexUsagePanel data={codex} />
    </div>
  );
}
Usage Progress Bar Component
// components/UsageSummaryCard.tsx
interface UsageSummaryProps {
  consumed: number;
  total: number;
  remaining: number;
  resetAt: string;
  daysRemaining: number;
}

export function UsageSummaryCard({
  consumed, total, remaining, resetAt, daysRemaining
}: UsageSummaryProps) {
  const utilization = (consumed / total) * 100;
  const barColor = utilization >= 95 ? '#ef4444'
    : utilization >= 80 ? '#f97316'
    : '#22c55e';

  const formatCents = (cents: number) =>
    `$${(cents / 100).toFixed(2)}`;

  return (
    <div className="summary-card">
      <h3>Current Billing Cycle Usage</h3>
      <div className="usage-stats">
        <span>{formatCents(consumed)} of {formatCents(total)}</span>
        <span>{utilization.toFixed(1)}% used</span>
      </div>
      <div className="progress-bar-container">
        <div
          className="progress-bar-fill"
          style={{ width: `${utilization}%`, backgroundColor: barColor }}
          role="progressbar"
          aria-valuenow={utilization}
          aria-valuemin={0}
          aria-valuemax={100}
        />
      </div>
      <div className="reset-info">
        <span>{formatCents(remaining)} remaining</span>
        <span>Resets in {daysRemaining} days</span>
      </div>
    </div>
  );
}
Burn Rate Predictor
The burn rate predictor is arguably the most valuable component in the dashboard. It takes the last 7 days of daily consumption data, calculates the average daily spend, and projects whether current consumption patterns will exhaust the remaining allowance before the billing cycle resets.
// utils/burnRateCalculator.ts
interface DailyUsage {
  date: string;
  cost_usd_cents: number;
}

export function calculateBurnRate(history: DailyUsage[], daysRemaining: number) {
  if (!history.length) return null;

  // Use last 7 days for rolling average
  const recentDays = history.slice(-7);
  const avgDailyBurn = recentDays.reduce(
    (sum, day) => sum + day.cost_usd_cents, 0
  ) / recentDays.length;

  const projectedRemainingCost = avgDailyBurn * daysRemaining;

  return {
    avgDailyBurn,
    projectedRemainingCost,
    trend: recentDays.length > 3
      ? calculateTrend(recentDays.map(d => d.cost_usd_cents))
      : 'insufficient_data'
  };
}

function calculateTrend(values: number[]): 'increasing' | 'decreasing' | 'stable' {
  const first = values.slice(0, Math.floor(values.length / 2));
  const second = values.slice(Math.floor(values.length / 2));
  const firstAvg = first.reduce((s, v) => s + v, 0) / first.length;
  const secondAvg = second.reduce((s, v) => s + v, 0) / second.length;
  const changeRate = (secondAvg - firstAvg) / firstAvg;
  if (changeRate > 0.1) return 'increasing';
  if (changeRate < -0.1) return 'decreasing';
  return 'stable';
}
Historical Chart with Recharts
// components/TokenHistoryChart.tsx
import {
  LineChart, Line, XAxis, YAxis, CartesianGrid,
  Tooltip, Legend, ResponsiveContainer
} from 'recharts';

export function TokenHistoryChart({ data }: { data: DailyUsage[] }) {
  const chartData = data.map(day => ({
    date: new Date(day.date).toLocaleDateString('en-US', { month: 'short', day: 'numeric' }),
    prompt: Math.round(day.prompt_tokens / 1000),
    completion: Math.round(day.completion_tokens / 1000),
    cost: (day.cost_usd_cents / 100).toFixed(2)
  }));

  return (
    <div className="chart-container">
      <h3>30-Day Token Consumption (thousands)</h3>
      <ResponsiveContainer width="100%" height={300}>
        <LineChart data={chartData}>
          <CartesianGrid strokeDasharray="3 3" />
          <XAxis dataKey="date" />
          <YAxis />
          <Tooltip />
          <Legend />
          <Line type="monotone" dataKey="prompt"
            stroke="#6366f1" name="Prompt Tokens (k)" />
          <Line type="monotone" dataKey="completion"
            stroke="#22c55e" name="Completion Tokens (k)" />
        </LineChart>
      </ResponsiveContainer>
    </div>
  );
}
For a deeper look at building complex data visualizations with AI-powered applications, see Building Real-Time AI Analytics Dashboards with React and OpenAI API.
Step 5: Setting Up Usage Alerts
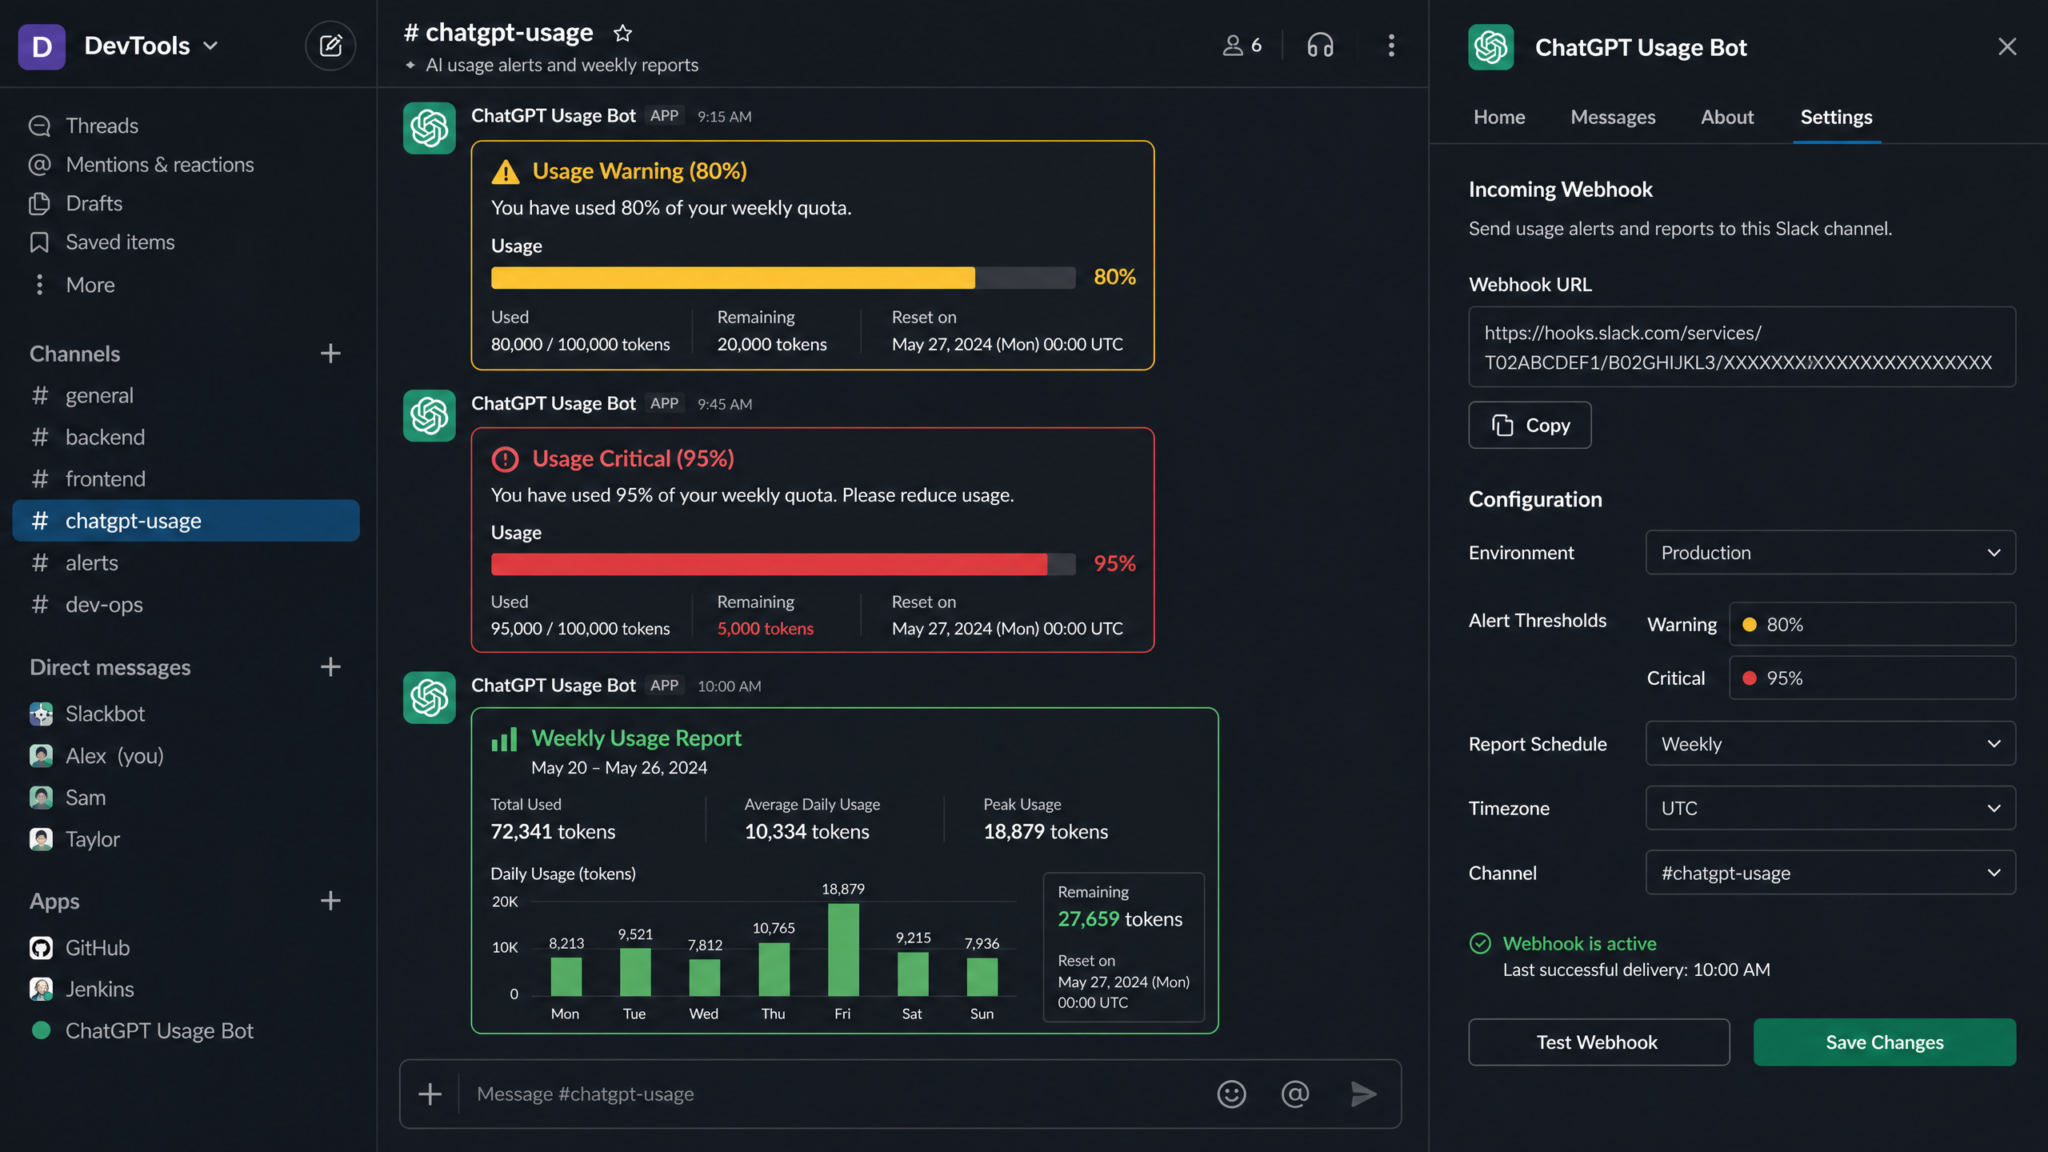
Reactive cost management — discovering an overage after the billing cycle closes — is unacceptable for any production AI deployment. A proactive alert system that fires at 80% utilization gives teams time to adjust; a 95% alert is the emergency brake. Building this system requires three components: a threshold evaluation engine, a notification dispatch layer, and webhook receiver logic for platforms like Slack.
Threshold Evaluation Engine
# Python: Alert threshold evaluator
from dataclasses import dataclass
from enum import Enum
from datetime import datetime, timezone
import httpx

class AlertLevel(Enum):
    WARNING = "warning"    # 80% threshold
    CRITICAL = "critical"  # 95% threshold

@dataclass
class UsageAlert:
    level: AlertLevel
    utilization_pct: float
    consumed_usd: float
    total_usd: float
    remaining_usd: float
    days_remaining: int
    avg_daily_burn_usd: float
    projected_overage_usd: float
    triggered_at: str

async def evaluate_thresholds(summary: dict) -> UsageAlert | None:
    utilization = summary["allowance"]["utilization_percentage"]
    warn_threshold = float(os.environ.get("ALERT_THRESHOLD_WARN", 0.80)) * 100
    critical_threshold = float(os.environ.get("ALERT_THRESHOLD_CRITICAL", 0.95)) * 100

    if utilization < warn_threshold:
        return None

    level = AlertLevel.CRITICAL if utilization >= critical_threshold else AlertLevel.WARNING

    # Calculate burn rate from history
    history = await fetch_recent_history(days=7)
    avg_daily = calculate_avg_daily_burn(history)
    remaining_cents = summary["allowance"]["remaining_usd_cents"]
    projected_overage = max(0, (avg_daily * summary["days_remaining"]) - remaining_cents)

    return UsageAlert(
        level=level,
        utilization_pct=utilization,
        consumed_usd=summary["allowance"]["consumed_usd_cents"] / 100,
        total_usd=summary["allowance"]["total_usd_cents"] / 100,
        remaining_usd=remaining_cents / 100,
        days_remaining=summary["days_remaining"],
        avg_daily_burn_usd=avg_daily / 100,
        projected_overage_usd=projected_overage / 100,
        triggered_at=datetime.now(timezone.utc).isoformat()
    )
Slack Integration
# Python: Slack webhook notification dispatcher
async def send_slack_alert(alert: UsageAlert):
    color = "#ff0000" if alert.level == AlertLevel.CRITICAL else "#ff9800"
    emoji = "🚨" if alert.level == AlertLevel.CRITICAL else "⚠️"

    payload = {
        "attachments": [{
            "color": color,
            "blocks": [
                {
                    "type": "header",
                    "text": {
                        "type": "plain_text",
                        "text": f"{emoji} OpenAI Usage {alert.level.value.upper()} Alert"
                    }
                },
                {
                    "type": "section",
                    "fields": [
                        {
                            "type": "mrkdwn",
                            "text": f"*Utilization:* {alert.utilization_pct:.1f}%"
                        },
                        {
                            "type": "mrkdwn",
                            "text": f"*Consumed:* ${alert.consumed_usd:.2f} of ${alert.total_usd:.2f}"
                        },
                        {
                            "type": "mrkdwn",
                            "text": f"*Remaining:* ${alert.remaining_usd:.2f}"
                        },
                        {
                            "type": "mrkdwn",
                            "text": f"*Days Left:* {alert.days_remaining}"
                        },
                        {
                            "type": "mrkdwn",
                            "text": f"*Avg Daily Burn:* ${alert.avg_daily_burn_usd:.2f}"
                        },
                        {
                            "type": "mrkdwn",
                            "text": f"*Projected Overage:* ${alert.projected_overage_usd:.2f}"
                        }
                    ]
                }
            ]
        }]
    }

    async with httpx.AsyncClient() as client:
        response = await client.post(
            os.environ["SLACK_WEBHOOK_URL"],
            json=payload
        )
        response.raise_for_status()

    return True
Webhook Receiver for Inbound Alerts
# FastAPI webhook receiver endpoint
from fastapi import FastAPI, Request, HTTPException, Header
import hmac, hashlib

app = FastAPI()

@app.post("/webhooks/usage-alert")
async def receive_usage_alert(
    request: Request,
    x_usage_signature: str = Header(None)
):
    body = await request.body()

    # Verify HMAC signature
    expected_sig = hmac.new(
        os.environ["USAGE_WEBHOOK_SECRET"].encode(),
        body,
        hashlib.sha256
    ).hexdigest()

    if not hmac.compare_digest(f"sha256={expected_sig}", x_usage_signature or ""):
        raise HTTPException(status_code=401, detail="Invalid webhook signature")

    payload = await request.json()
    alert = UsageAlert(**payload)

    # Route based on severity
    if alert.level == AlertLevel.CRITICAL:
        await send_slack_alert(alert)
        await send_email_alert(alert, recipients=["[email protected]", "[email protected]"])
    else:
        await send_slack_alert(alert)

    return {"status": "processed"}
For production alert systems, consider how this integrates with your existing observability stack. Integrating OpenAI API Monitoring with Datadog and PagerDuty covers the full observability pipeline.
Step 6: Team Usage Monitoring
Individual usage tracking is straightforward. Team usage monitoring — where you need to attribute consumption to specific engineers, projects, or business units — requires a more sophisticated architecture. The core challenge is that the OpenAI Usage Data API reports at the organization level by default. Per-user attribution requires tagging every API request with metadata that your own middleware layer tracks.
Access 40,000+ AI Prompts for ChatGPT, Claude & Codex — Free!
Subscribe to get instant access to our complete Notion Prompt Library — the largest curated collection of prompts for ChatGPT, Claude, OpenAI Codex, and other leading AI models. Optimized for real-world workflows across coding, research, content creation, and business.
Request Tagging Strategy
The most reliable attribution approach is to route all OpenAI API calls through your own proxy service. This proxy adds user identification headers, logs request metadata to your own database, and forwards the actual API call to OpenAI. The proxy doesn't need to inspect request bodies (preserving data privacy) — it only needs to log the model called, the response token count from the usage object in every completion response, and the authenticated user making the request.
# Python: Usage-tracking proxy middleware using FastAPI
from fastapi import FastAPI, Request, Depends
from sqlalchemy.ext.asyncio import AsyncSession
import httpx, time

app = FastAPI()

@app.post("/proxy/chat/completions")
async def proxy_completion(
    request: Request,
    current_user: User = Depends(get_current_user),
    db: AsyncSession = Depends(get_db)
):
    body = await request.json()
    model = body.get("model", "unknown")
    start_time = time.time()

    async with httpx.AsyncClient() as client:
        openai_response = await client.post(
            "https://api.openai.com/v1/chat/completions",
            json=body,
            headers={
                "Authorization": f"Bearer {os.environ['OPENAI_API_KEY']}",
                "Content-Type": "application/json"
            }
        )

    duration_ms = int((time.time() - start_time) * 1000)
    response_data = openai_response.json()

    # Log usage attribution to your own database
    if openai_response.status_code == 200 and "usage" in response_data:
        await db.execute(
            """INSERT INTO api_usage_log
               (user_id, team_id, model, prompt_tokens, completion_tokens,
                total_tokens, duration_ms, created_at)
               VALUES (:uid, :tid, :model, :pt, :ct, :tt, :dur, NOW())""",
            {
                "uid": current_user.id,
                "tid": current_user.team_id,
                "model": model,
                "pt": response_data["usage"]["prompt_tokens"],
                "ct": response_data["usage"]["completion_tokens"],
                "tt": response_data["usage"]["total_tokens"],
                "dur": duration_ms
            }
        )

    return response_data
Aggregated Team Usage Query
# Python: Team usage aggregation query
async def get_team_usage_breakdown(
    team_id: str,
    start_date: str,
    end_date: str,
    db: AsyncSession
) -> list[dict]:
    result = await db.execute(
        """
        SELECT
            u.name AS user_name,
            u.email AS user_email,
            aul.model,
            SUM(aul.prompt_tokens) AS total_prompt_tokens,
            SUM(aul.completion_tokens) AS total_completion_tokens,
            SUM(aul.total_tokens) AS total_tokens,
            COUNT(*) AS request_count,
            AVG(aul.duration_ms) AS avg_duration_ms,
            -- Cost calculation: GPT-4o rates
            SUM(
                CASE WHEN aul.model = 'gpt-4o'
                THEN (aul.prompt_tokens * 0.000005 + aul.completion_tokens * 0.000015)
                WHEN aul.model = 'gpt-3.5-turbo'
                THEN (aul.prompt_tokens * 0.0000005 + aul.completion_tokens * 0.0000015)
                ELSE 0 END
            ) AS estimated_cost_usd
        FROM api_usage_log aul
        JOIN users u ON u.id = aul.user_id
        WHERE aul.team_id = :team_id
          AND aul.created_at BETWEEN :start_date AND :end_date
        GROUP BY u.id, u.name, u.email, aul.model
        ORDER BY total_tokens DESC
        """,
        {"team_id": team_id, "start_date": start_date, "end_date": end_date}
    )
    return [dict(row) for row in result.fetchall()]
Identifying Heavy Users and Optimizing Allocation
Raw consumption numbers alone don't tell the full story. A developer writing automated test suites that call GPT-4o 1,000 times per day may be generating far more value than a developer who makes 10 manual calls. The team monitoring dashboard should present consumption alongside output metrics where available: lines of code generated per token, documentation pages created per request, or task completion rates for Codex workloads.
| User | Monthly Tokens | Est. Cost | Requests | Avg Tokens/Request | Primary Model |
|---|---|---|---|---|---|
| Sarah K. | 4.2M | $84.00 | 2,840 | 1,479 | GPT-4o |
| Marcus T. | 3.8M | $19.00 | 12,400 | 306 | GPT-3.5 Turbo |
| Priya N. | 1.1M | $22.00 | 920 | 1,196 | GPT-4 Turbo |
| James W. | 890K | $4.45 | 8,200 | 109 | GPT-3.5 Turbo |
Notice that Marcus drives high request volume at low cost by correctly using GPT-3.5 Turbo for high-frequency, low-complexity tasks. This is exactly the usage pattern you want to reward and replicate across the team. Budget conversations become data-driven rather than anecdotal when you can present this breakdown to engineering managers.
Step 7: Integrating with Billing Systems
Connecting OpenAI usage data to your billing infrastructure transforms usage monitoring from a developer tool into a finance tool. This integration is essential for teams operating under chargeback models, where individual business units or departments are responsible for their own AI infrastructure costs.
Cost Calculation Layer
OpenAI's published pricing is the foundation of your cost calculations. Maintaining a pricing configuration file rather than hardcoding rates makes it straightforward to update when pricing changes:
# Python: Pricing configuration and cost calculator
OPENAI_PRICING = {
    "gpt-4o": {
        "prompt_per_1k": 0.005,
        "completion_per_1k": 0.015,
        "cached_prompt_per_1k": 0.0025
    },
    "gpt-4o-mini": {
        "prompt_per_1k": 0.00015,
        "completion_per_1k": 0.0006,
        "cached_prompt_per_1k": 0.000075
    },
    "gpt-4-turbo": {
        "prompt_per_1k": 0.01,
        "completion_per_1k": 0.03,
        "cached_prompt_per_1k": 0.005
    },
    "gpt-3.5-turbo": {
        "prompt_per_1k": 0.0005,
        "completion_per_1k": 0.0015,
        "cached_prompt_per_1k": 0.00025
    }
}

def calculate_cost(
    model: str,
    prompt_tokens: int,
    completion_tokens: int,
    cached_prompt_tokens: int = 0
) -> float:
    """Returns cost in USD"""
    pricing = OPENAI_PRICING.get(model, OPENAI_PRICING["gpt-3.5-turbo"])

    # Cached tokens are billed separately at reduced rate
    non_cached_prompt = prompt_tokens - cached_prompt_tokens

    cost = (
        (non_cached_prompt / 1000) * pricing["prompt_per_1k"] +
        (cached_prompt_tokens / 1000) * pricing["cached_prompt_per_1k"] +
        (completion_tokens / 1000) * pricing["completion_per_1k"]
    )
    return round(cost, 6)
Department Chargeback Report Generator
# Python: Monthly chargeback report generation
from datetime import datetime
import pandas as pd

async def generate_chargeback_report(
    billing_month: str,  # Format: "2024-11"
    db: AsyncSession
) -> dict:
    """
    Generate department-level chargeback data for finance integration.
    Returns structured data suitable for export to Stripe, QuickBooks, or CSV.
    """
    rows = await db.execute(
        """
        SELECT
            d.name AS department,
            d.cost_center_code,
            d.billing_contact_email,
            SUM(aul.total_tokens) AS total_tokens,
            SUM(calculated_cost) AS total_cost_usd,
            COUNT(DISTINCT aul.user_id) AS active_users,
            COUNT(*) AS total_requests
        FROM api_usage_log aul
        JOIN users u ON u.id = aul.user_id
        JOIN departments d ON d.id = u.department_id
        WHERE DATE_FORMAT(aul.created_at, '%%Y-%%m') = :billing_month
        GROUP BY d.id, d.name, d.cost_center_code, d.billing_contact_email
        ORDER BY total_cost_usd DESC
        """,
        {"billing_month": billing_month}
    )

    departments = [dict(row) for row in rows.fetchall()]
    total_cost = sum(d["total_cost_usd"] for d in departments)

    return {
        "billing_month": billing_month,
        "generated_at": datetime.utcnow().isoformat(),
        "total_organization_cost_usd": round(total_cost, 2),
        "departments": [
            {
                **dept,
                "total_cost_usd": round(dept["total_cost_usd"], 2),
                "cost_percentage": round(
                    (dept["total_cost_usd"] / total_cost) * 100, 2
                ) if total_cost > 0 else 0,
                "cost_per_user_usd": round(
                    dept["total_cost_usd"] / dept["active_users"], 2
                ) if dept["active_users"] > 0 else 0
            }
            for dept in departments
        ]
    }
ROI Calculation Framework
Pure cost tracking without ROI context produces cost anxiety rather than optimization insight. A simple ROI framework pairs AI consumption costs against measurable outcomes. For engineering teams, the most accessible metric is developer time saved:
# Python: ROI calculation for code generation use cases
def calculate_code_gen_roi(
    monthly_cost_usd: float,
    lines_of_code_generated: int,
    avg_hourly_developer_rate: float = 85.0,
    lines_per_developer_hour: int = 40  # Conservative estimate
) -> dict:
    """
    Estimates ROI for AI-assisted code generation investment.
    """
    developer_hours_equivalent = lines_of_code_generated / lines_per_developer_hour
    developer_cost_equivalent = developer_hours_equivalent * avg_hourly_developer_rate

    roi_multiple = developer_cost_equivalent / monthly_cost_usd if monthly_cost_usd > 0 else 0
    net_savings = developer_cost_equivalent - monthly_cost_usd

    return {
        "monthly_ai_cost_usd": round(monthly_cost_usd, 2),
        "lines_generated": lines_of_code_generated,
        "developer_hours_equivalent": round(developer_hours_equivalent, 1),
        "developer_cost_equivalent_usd": round(developer_cost_equivalent, 2),
        "net_savings_usd": round(net_savings, 2),
        "roi_multiple": round(roi_multiple, 2),
        "roi_percentage": round((roi_multiple - 1) * 100, 1)
    }
Understanding how AI API costs fit into broader product infrastructure spend is covered in depth in OpenAI API Cost Optimization Strategies for Production Applications.
Step 8: Error Handling and Rate Limits
Production usage monitoring systems must handle API errors gracefully. The Usage Data API can return several error classes, and your application's behavior in each case should be carefully designed.
Error Response Schema
# Possible error responses from the Usage Data API
{
  "error": {
    "type": "authentication_error",
    "code": "invalid_api_key",
    "message": "No API key provided or key is invalid.",
    "status": 401
  }
}

{
  "error": {
    "type": "rate_limit_error",
    "code": "usage_api_rate_limit_exceeded",
    "message": "You have exceeded the usage API rate limit of 120 requests/minute.",
    "status": 429,
    "retry_after": 12
  }
}

{
  "error": {
    "type": "server_error",
    "code": "usage_data_unavailable",
    "message": "Usage data is temporarily unavailable. Retry after 60 seconds.",
    "status": 503,
    "retry_after": 60
  }
}
Robust Retry Logic with Exponential Backoff
# Python: Production-grade retry handler
import asyncio
from typing import TypeVar, Callable, Any
import httpx

T = TypeVar('T')

async def with_retry(
    func: Callable[[], Any],
    max_attempts: int = 3,
    base_delay: float = 1.0,
    max_delay: float = 60.0
):
    last_exception = None

    for attempt in range(max_attempts):
        try:
            return await func()
        except httpx.HTTPStatusError as e:
            last_exception = e
            status = e.response.status_code

            if status == 401:
                # Authentication errors are not retryable
                raise RuntimeError(
                    "Usage API authentication failed. Check OPENAI_USAGE_API_KEY."
                ) from e

            if status == 429:
                # Respect the Retry-After header if present
                retry_after = float(e.response.headers.get("Retry-After", base_delay))
                await asyncio.sleep(min(retry_after, max_delay))
                continue

            if status >= 500:
                # Server errors: exponential backoff
                delay = min(base_delay * (2 ** attempt), max_delay)
                await asyncio.sleep(delay)
                continue

            # 4xx errors other than 401/429 are not retryable
            raise

        except httpx.NetworkError:
            delay = min(base_delay * (2 ** attempt), max_delay)
            await asyncio.sleep(delay)

    raise last_exception
Circuit Breaker Pattern
For usage monitoring systems that run as background services, a circuit breaker prevents your monitoring infrastructure from hammering a degraded Usage API and accumulating unnecessary errors in your logs:
# Python: Simple circuit breaker for usage API calls
from enum import Enum
from datetime import datetime, timedelta

class CircuitState(Enum):
    CLOSED = "closed"      # Normal operation
    OPEN = "open"          # Failing fast, not making calls
    HALF_OPEN = "half_open"  # Testing recovery

class UsageAPICircuitBreaker:
    def __init__(self, failure_threshold=5, recovery_timeout=300):
        self.failure_threshold = failure_threshold
        self.recovery_timeout = recovery_timeout
        self.failure_count = 0
        self.last_failure_time = None
        self.state = CircuitState.CLOSED

    def record_success(self):
        self.failure_count = 0
        self.state = CircuitState.CLOSED

    def record_failure(self):
        self.failure_count += 1
        self.last_failure_time = datetime.utcnow()
        if self.failure_count >= self.failure_threshold:
            self.state = CircuitState.OPEN

    def can_execute(self) -> bool:
        if self.state == CircuitState.CLOSED:
            return True
        if self.state == CircuitState.OPEN:
            recovery_due = (
                self.last_failure_time +
                timedelta(seconds=self.recovery_timeout)
            )
            if datetime.utcnow() >= recovery_due:
                self.state = CircuitState.HALF_OPEN
                return True
            return False
        return True  # HALF_OPEN: allow one test request

usage_circuit_breaker = UsageAPICircuitBreaker()
Step 9: Caching Best Practices
Caching is not an optimization for usage monitoring — it's a fundamental architectural requirement. Usage data doesn't change in real time at a resolution that justifies frequent polling, and your dashboard consumers (browsers, reports, alert checks) should never directly hit the Usage API. The caching layer you build here will also protect you against Usage API outages causing your monitoring dashboard to go dark.
Cache TTL Strategy by Endpoint
| Endpoint | Update Frequency | Recommended Cache TTL | Rationale |
|---|---|---|---|
/v1/usage/summary |
Near real-time | 5 minutes | Balances freshness with API load |
/v1/usage/history |
Daily | 1 hour | Historical data changes slowly |
/v1/usage/codex |
Per-task completion | 5 minutes | Active Codex runs need visibility |
| Team breakdown queries | Your own DB | 15 minutes | Aggregates are expensive to compute |
| Chargeback reports | Monthly | 24 hours | Immutable once billing cycle closes |
Redis Cache Implementation
# Python: Redis-based caching layer for usage data
import json
import redis.asyncio as aioredis
from functools import wraps

redis_client = aioredis.from_url(
    os.environ["REDIS_URL"],
    encoding="utf-8",
    decode_responses=True
)

def cache_usage_response(ttl_seconds: int, key_prefix: str):
    """Decorator for caching Usage API responses in Redis"""
    def decorator(func):
        @wraps(func)
        async def wrapper(*args, **kwargs):
            # Build cache key from function name and arguments
            cache_key = f"usage:{key_prefix}:{hash(str(args) + str(kwargs))}"

            # Check cache first
            cached = await redis_client.get(cache_key)
            if cached:
                return json.loads(cached)

            # Cache miss: call the actual function
            result = await func(*args, **kwargs)

            # Store in cache with TTL
            await redis_client.setex(
                cache_key,
                ttl_seconds,
                json.dumps(result)
            )

            return result
        return wrapper
    return decorator

@cache_usage_response(ttl_seconds=300, key_prefix="summary")
async def get_cached_usage_summary() -> dict:
    return await fetch_usage_summary()

@cache_usage_response(ttl_seconds=3600, key_prefix="history")
async def get_cached_usage_history(start_date: str, end_date: str) -> dict:
    return await fetch_usage_history(start_date, end_date)
Cache Invalidation on Alert Triggers
When an alert fires at the 80% or 95% threshold, you want the dashboard to reflect the most current data immediately. Implement a forced cache invalidation that triggers on every alert event:
# Python: Forced cache invalidation for alert triggers
async def invalidate_usage_cache():
    """
    Force-invalidate all cached usage data when alerts trigger.
    Call this before sending alert notifications to ensure
    dashboard users see current data.
    """
    pattern = "usage:summary:*"
    keys = await redis_client.keys(pattern)
    if keys:
        await redis_client.delete(*keys)

    # Also clear the codex cache if Codex limits are involved
    codex_pattern = "usage:codex:*"
    codex_keys = await redis_client.keys(codex_pattern)
    if codex_keys:
        await redis_client.delete(*codex_keys)

async def trigger_alert_with_cache_refresh(alert: UsageAlert):
    await invalidate_usage_cache()
    await send_slack_alert(alert)
    if alert.level == AlertLevel.CRITICAL:
        await send_email_alert(alert)
Stale-While-Revalidate Pattern
For dashboard components where stale data is acceptable (historical charts, team breakdowns), implement a stale-while-revalidate pattern that returns cached data immediately while refreshing in the background. This keeps your dashboard responsive even during slow API conditions:
# Python: Stale-while-revalidate implementation
import asyncio
from datetime import datetime

class StaleWhileRevalidateCache:
    def __init__(self, redis_client, ttl: int, stale_ttl: int):
        self.redis = redis_client
        self.ttl = ttl
        self.stale_ttl = stale_ttl  # How long to serve stale data

    async def get_or_fetch(self, key: str, fetch_fn) -> tuple[dict, bool]:
        """
        Returns (data, is_stale) tuple.
        Triggers background refresh if data is stale.
        """
        cached_raw = await self.redis.get(f"data:{key}")
        meta_raw = await self.redis.get(f"meta:{key}")

        if cached_raw and meta_raw:
            meta = json.loads(meta_raw)
            cached_at = datetime.fromisoformat(meta["cached_at"])
            age_seconds = (datetime.utcnow() - cached_at).total_seconds()

            if age_seconds < self.ttl:
                return json.loads(cached_raw), False  # Fresh data

            if age_seconds < self.stale_ttl:
                # Serve stale data, trigger background refresh
                asyncio.create_task(self._background_refresh(key, fetch_fn))
                return json.loads(cached_raw), True  # Stale data

        # Cache miss or too stale: fetch synchronously
        fresh_data = await fetch_fn()
        await self._store(key, fresh_data)
        return fresh_data, False

    async def _background_refresh(self, key: str, fetch_fn):
        try:
            fresh_data = await fetch_fn()
            await self._store(key, fresh_data)
        except Exception:
            pass  # Background refresh failures are non-fatal

    async def _store(self, key: str, data: dict):
        pipeline = self.redis.pipeline()
        pipeline.setex(f"data:{key}", self.stale_ttl, json.dumps(data))
        pipeline.setex(f"meta:{key}", self.stale_ttl, json.dumps({
            "cached_at": datetime.utcnow().isoformat()
        }))
        await pipeline.execute()
For teams working with complex API integrations, understanding the full scope of what's possible with OpenAI's platform APIs is valuable. Complete Guide to OpenAI Platform API Features and Enterprise Capabilities provides comprehensive coverage of the broader API ecosystem.
Conclusion and Next Steps
Building a production-grade usage monitoring system for your OpenAI consumption is a multi-layer engineering effort that pays dividends across engineering, finance, and operations teams. Let's summarize what you've built through this guide:
What You've Built
- API Integration Layer: Full Python and JavaScript clients for all three Usage Data API endpoints, with proper authentication handling for both API key and OAuth 2.0 flows
- React Dashboard: Real-time usage visualization with progress bars, historical trend charts, per-model breakdowns, and a burn rate predictor that flags when current spending patterns will exceed the billing cycle allowance
- Alert System: Threshold evaluation at 80% and 95% utilization with Slack and email notifications, webhook receiver with HMAC signature verification, and cache invalidation on alert triggers
- Team Attribution: Request tagging proxy middleware that attributes API consumption to individual users and departments without requiring changes to the OpenAI API itself
- Billing Integration: Cost calculation engine using real pricing data, department chargeback report generation, and an ROI framework for justifying AI infrastructure investment
- Production Infrastructure: Retry logic with exponential backoff, circuit breaker pattern, Redis caching with appropriate TTLs by data type, and stale-while-revalidate for dashboard responsiveness
Recommended Implementation Sequence
- Start with the basic summary endpoint integration and a simple utilization display — this delivers immediate value in hours
- Add Redis caching before scaling the polling frequency, not after
- Deploy the alert system next; catching a 95% utilization event before it becomes an overage is worth days of development time
- Build the proxy middleware for team attribution in parallel with the dashboard — it needs time to accumulate data before the breakdown views are meaningful
- Add billing integration last, once you have 30+ days of attribution data to make the chargeback reports credible
Future Enhancements
As your usage monitoring system matures, consider adding anomaly detection (flagging usage spikes that deviate significantly from historical patterns), cost forecasting models trained on your own consumption history, and per-project attribution by adding project identifiers to your request tagging proxy. For teams using OpenAI's fine-tuned models, extending the cost calculation layer to include fine-tuning run costs rounds out the complete picture of your AI infrastructure spend.
The Usage Data API is your foundation for treating AI infrastructure costs with the same rigor you apply to cloud compute, storage, and bandwidth. Teams that build this monitoring infrastructure early develop the institutional knowledge to scale their AI usage responsibly — and to confidently justify continued investment because they can prove, with data, that it's working.
For deeper exploration of managing and optimizing production AI deployments, Production OpenAI API Architecture Patterns for Scalable Applications covers the broader system design considerations that complement the monitoring infrastructure you've built here.
