Codex Data Analysis Masterclass: 30 Production-Ready Prompts for Automated Reporting, Dashboard Generation, and Business Intelligence Workflows

Codex Data Analysis Masterclass: 30 Production-Ready Prompts for Automated Reporting, Dashboard Generation, and Business Intelligence Workflows
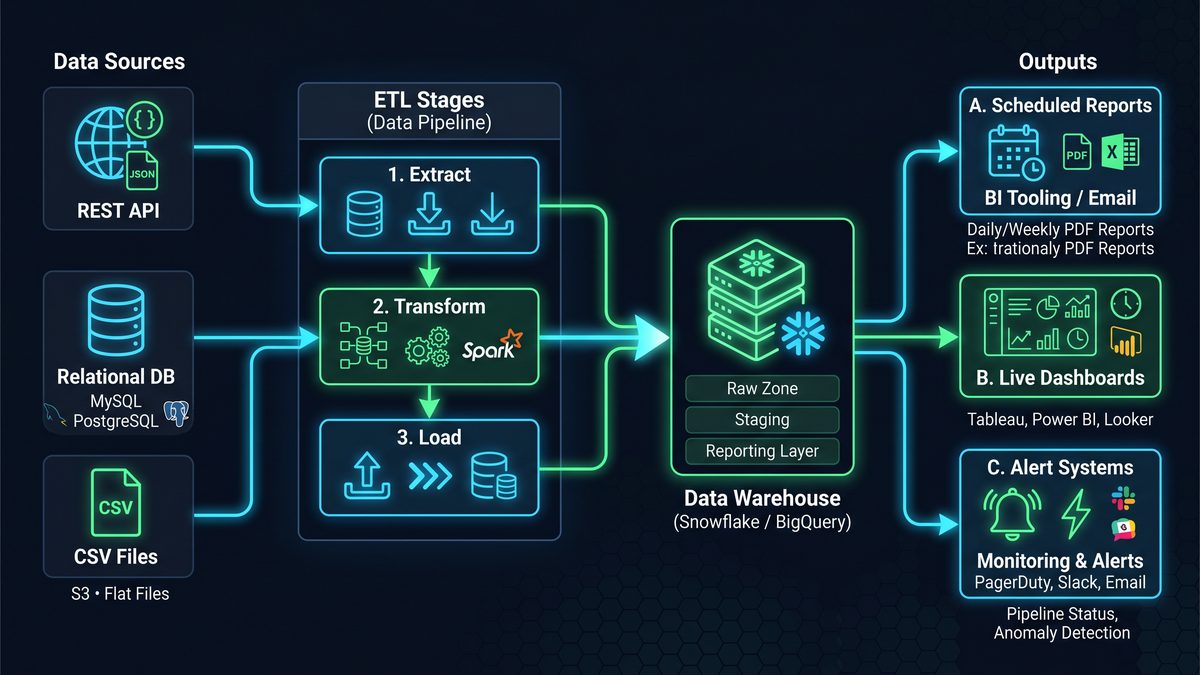
This masterclass is a developer-focused, deeply technical collection of 30 production-ready prompts designed to use Codex (or any code-capable LLM) to automate data pipelines, generate interactive dashboards, schedule reports, perform statistical analyses, and build lightweight BI tools without heavy engineering support. Each prompt is presented as a blueprint: precise system configuration, variable definitions, realistic data schemas, sample payloads, execution steps, expected outputs, integration guidance, and edge-case handling. Use these blueprints as drop-in templates for automating analytics workflows, integrating with ETL systems, or scaffolding analytics microservices.
Important: Replace placeholders like API keys, database credentials, and hostnames with secrets stored in your secret manager. Always run generated SQL, Python, or shell commands in an isolated environment first.
How to read this masterclass
Each prompt follows a consistent structure:
- Use case: real operational scenario.
- System configuration: Codex model and runtime parameters to achieve deterministic, secure outputs.
- Variables: external parameters and types, used to parameterize prompts and pipeline runs.
- Data schema: realistic JSON Schema or DDL describing expected inputs.
- Sample input: small representative dataset or connection details.
- Execution steps: step-by-step instructions for Codex to follow, including validation and transformation heuristics.
- Expected output: precise structure and examples of the artifacts Codex should return (SQL, Python functions, JSON, Vega-Lite specs, dashboards, CSV reports).
- Integration notes: scheduling, connectors, and runtime integration with Airflow, Prefect, dbt, or serverless functions.
- Edge cases & validation: rules and checks to harden the prompt for production.
Use the prompts verbatim to seed your Codex invocations. Modify variables and schemas to fit your domain.
Prompt 01 — Automated Daily Sales Report and Anomaly Detection
Use case
Generate a production-ready daily sales report with anomaly detection on sales volume and unit price shifts by region and product category. Output includes: a CSV report, SQL query, and a lightweight HTML dashboard with plots (using Vega-Lite) and an anomalies JSON for downstream alerting.
System configuration
{
  "model": "code-davinci-002",
  "temperature": 0.0,
  "max_tokens": 1600,
  "top_p": 1.0,
  "frequency_penalty": 0.0,
  "presence_penalty": 0.0,
  "stop": ["### END"]
}
Variables
| Name | Type | Description | Example |
|---|---|---|---|
| report_date | string (YYYY-MM-DD) | Date for which to compute the daily report | 2026-06-20 |
| source_table | string | Fully-qualified transactional table | analytics.sales_transactions |
| region_filter | array[string] | Optional region list to filter | [“EMEA”,”APAC”] |
| currency | string | Reporting currency, assume USD conversion available | USD |
Data schema (JSON Schema)
{
  "type": "object",
  "properties": {
    "transaction_id": {"type": "string"},
    "timestamp": {"type": "string", "format": "date-time"},
    "region": {"type": "string"},
    "product_category": {"type": "string"},
    "units": {"type": "integer"},
    "unit_price": {"type": "number"},
    "currency": {"type": "string"}
  },
  "required": ["transaction_id","timestamp","region","product_category","units","unit_price","currency"]
}
Sample input (SQL + small dataset)
-- Parameters:
-- report_date = '2026-06-20'

SELECT transaction_id, timestamp, region, product_category, units, unit_price, currency
FROM analytics.sales_transactions
WHERE DATE(timestamp) = '2026-06-20'
  AND (region IN ('EMEA','APAC') OR ARRAY_LENGTH(:region_filter) = 0)
LIMIT 1000;
Execution steps
- Validate incoming data schema against JSON Schema: check types, missing values, timestamp parsing.
- Normalize currency using an exchange_rates table if currency != reporting currency.
- Aggregate to region x product_category: sum(units), sum(revenue), avg(unit_price), transactions_count.
- Run anomaly detection per time series (region-product): compute rolling 7-day mean/SD; flag points where value > mean + 3*SD or < mean - 3*SD. Use robust stats if outliers exist (median + MAD).
- Generate a CSV report with aggregated metrics and anomaly flag.
- Produce a Vega-Lite JSON spec for a dashboard with two charts: time-series with anomalies overlaid, and a heatmap of region x product_category revenue.
- Return an anomalies JSON array with anomaly_score, baseline, and recommended action (e.g., “Investigate pricing engine”).
Expected output
Return a JSON object with keys: sql, csv_preview, vega_lite_spec, anomalies_json. Example anomalies record:
{
  "anomalies": [
    {
      "region": "EMEA",
      "product_category": "Electronics",
      "date": "2026-06-20",
      "metric": "revenue",
      "value": 125000.00,
      "baseline_mean": 43000.00,
      "baseline_sd": 15000.00,
      "anomaly_score": 5.33,
      "recommended_action": "Check B2B bulk orders and promotions"
    }
  ]
}
Integration
Schedule as an Airflow DAG: extract via the provided SQL, run transformation in Python operator that performs currency normalization and anomaly detection using numpy/pandas, and push Vega-Lite JSON to the BI static assets S3 bucket. Configure alerts to publish the anomalies JSON to an SNS topic or PagerDuty.
Edge cases & validation
- If transaction_id duplicates exist, de-duplicate with the latest timestamp.
- When historical data < 14 days, use robust median/MAD thresholds.
- If sample size per group < 5, set anomaly_score to null and place a "low confidence" flag.
Prompt 02 — Backfill ETL Script Generator for Event Data
Use case
Generate a parameterized backfill script to reprocess event batches for a specified date range. Output is a Python script that reads raw S3 event parquet, applies cleansing rules, writes to a partitioned analytics table, and emits a summary manifest.
System configuration
{
  "model": "code-davinci-002",
  "temperature": 0.0,
  "max_tokens": 1800,
  "top_p": 1.0
}
Variables
| Name | Type | Description | Example |
|---|---|---|---|
| start_date | string | Inclusive start date (YYYY-MM-DD) | 2026-06-01 |
| end_date | string | Exclusive end date | 2026-06-07 |
| raw_s3_prefix | string | S3 prefix where raw events are stored | s3://company-raw/events/ |
| target_table | string | Destination analytics table | warehouse.events_processed |
Data schema (JSON Schema)
{
  "type": "object",
  "properties": {
    "event_id": {"type": "string"},
    "user_id": {"type": "string"},
    "event_type": {"type": "string"},
    "event_timestamp": {"type": "string", "format": "date-time"},
    "attributes": {"type": "object"},
    "ingest_timestamp": {"type": "string", "format": "date-time"}
  },
  "required": ["event_id","user_id","event_type","event_timestamp"]
}
Sample input
Raw Parquet paths:
s3://company-raw/events/2026/06/01/part-000.parquet
s3://company-raw/events/2026/06/02/part-000.parquet
...
Execution steps
- Generate Python script using PyArrow/Pandas or Spark (auto-select Spark if individual partition size > 500MB).
- Implement validation: schema conformance, timestamp parsing, duplicate event_id detection.
- Implement cleansing rules: standardize event_type casing, flatten attributes keys that match whitelist, drop blacklisted attributes, mask PII (emails, phone numbers) via regex.
- Write out to partitioned parquet by event_date and load into target_table using atomic replace or upsert semantics depending on warehouse capabilities (MERGE for Snowflake/BigQuery MERGE-like operation, INSERT OVERWRITE for Hive).
- Emit manifest.json with processed_count, error_count, first_ingest, last_ingest, input_paths, and output_path.
Expected output
Return a Python script with CLI arguments (–start_date, –end_date, –raw_s3_prefix, –target_table, –use_spark boolean) plus a manifest JSON example.
Integration
Pack script into a CI/CD job for backfills. Provide a Helm chart for running as a Kubernetes job. Add idempotency by checking manifest for target partitions and skipping if already present.
Edge cases
- Partial partitions: write to a staging path and atomically swap output.
- Schema drift: if new keys appear under attributes, create an “attributes_json” column instead of failing.
Prompt 03 — Lightweight BI API: Schema-first GraphQL Server Generator
Use case
Generate a minimal GraphQL server scaffold (Python/Graphene or Node/Express + Apollo) that exposes a schema tailored to analytics queries: metrics, dimensions, time bucketing, basic filters. Designed for non-engineering analysts to query aggregated metrics via API.
System configuration
{
  "model": "code-davinci-002",
  "temperature": 0.0,
  "max_tokens": 1400
}
Variables
| Name | Type | Description | Example |
|---|---|---|---|
| storage_backend | string | DB connector (postgres,snowflake,bigquery) | snowflake |
| metrics | array[string] | List of metric names supported | [“revenue”,”orders”,”active_users”] |
| dimensions | array[string] | Dimension names | [“region”,”product_category”,”platform”] |
Data schema
Assume an aggregated table analytics.daily_metrics with columns: report_date (date), region (string), product_category (string), platform (string), revenue (numeric), orders (int), active_users (int).
Execution steps
- Generate GraphQL type definitions: Query root with metrics(queryInputs) returning list of MetricRow.
- Implement resolvers that build parameterized SQL given the storage_backend and protection against SQL injection (use prepared statements/bind params).
- Add pagination, caching headers, and query cost estimation (max rows guard).
- Return server scaffold and deployment instructions using Dockerfile and Kubernetes Deployment manifest.
Expected output
Server code (app.py/index.js), GraphQL schema file, Dockerfile, and a sample GraphQL query example.
Integration
Bind authentication via an API gateway or JWT; enforce RBAC so analysts can only query approved dimensions and metrics. Implement rate limiting and query quotas in the gateway to prevent large scans.
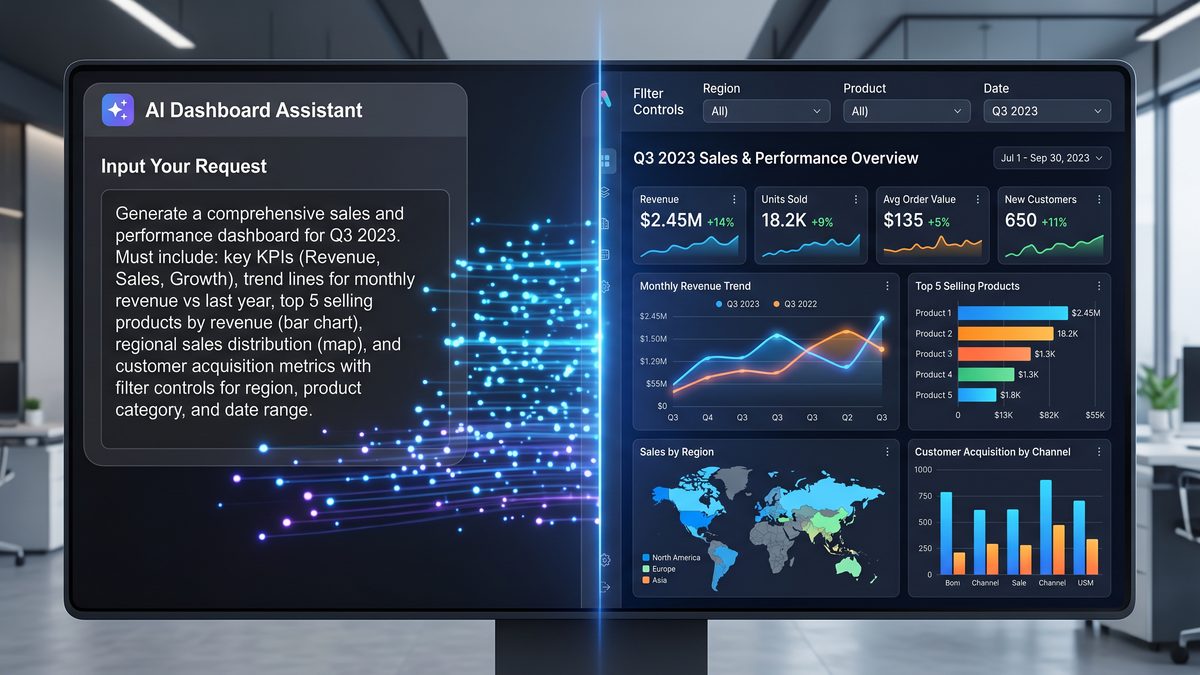
Prompt 04 — Dashboard Generator: From SQL to Interactive Vega-Lite Panel
Use case
Convert a provided SQL query into a responsive Vega-Lite visualization and a minimal HTML container that can be embedded into an internal dashboarding tool. Include parameter controls (date range pickers, dimension selectors) and pre-aggregation hints for performance.
System configuration
{
  "model": "code-davinci-002",
  "temperature": 0.0,
  "max_tokens": 1200
}
Variables
| Name | Type | Description | Example |
|---|---|---|---|
| sql_query | string | Base SQL returning columns for visualization | SELECT report_date, region, revenue FROM analytics.daily_metrics |
| visual_type | string | bar/line/heatmap/stacked_area | line |
| date_column | string | Time column for bucketing | report_date |
Data schema
Design uses column metadata: type (date, number, string). The prompt should derive or accept metadata and produce a Vega-Lite spec with proper encodings.
Execution steps
- Analyze the SQL to detect groupings and aggregates; if raw rows returned, add aggregation using GROUP BY date_column,dimension.
- Infer axis scales, time parsing formats, and tooltip content.
- Generate Vega-Lite spec and an HTML file with parameter control widgets using plain JS (no frameworks) that re-requests a parameterized endpoint to fetch JSON data.
- Include performance hints: suggest adding a summary materialized table or a pre-aggregation if the cardinality of dimension exceeds threshold (e.g., >500 unique values).
Expected output
Return the Vega-Lite JSON spec, HTML container, and recommended pre-aggregation SQL.
Prompt 05 — Scheduled KPI Snapshot: Cron-ready Lambda Function
Use case
Create an AWS Lambda function (Python) that runs nightly, computes key KPIs (MAU, DAU, conversion rate), writes a compact JSON snapshot to S3, and emits CloudWatch metric data points for dashboarding.
System configuration
{
  "model": "code-davinci-002",
  "temperature": 0.0,
  "max_tokens": 1400
}
Variables
| Name | Type | Description | Example |
|---|---|---|---|
| start_time | string | UTC start of the snapshot window | 2026-06-19T00:00:00Z |
| end_time | string | UTC end of the snapshot window | 2026-06-20T00:00:00Z |
| s3_bucket | string | Destination S3 bucket | company-kpi-snapshots |
Data schema
Assume events table with event_type names: session_start, purchase, register. KPI definitions: DAU = count(distinct user_id) where event_type=session_start within day; MAU = distinct user_id in last 30 days; conversion_rate = purchases / sessions.
Execution steps
- Generate Lambda handler: connects to warehouse via VPC endpoint (if needed), runs parameterized SQLs to compute KPIs.
- Serialize snapshot JSON with schema: snapshot_time, window_start, window_end, dau, mau, conversion_rate, computed_metrics (list of sql statements with runtime).
- Put snapshot to S3 with path s3://{s3_bucket}/snapshots/YYYY/MM/DD/snapshot.json
- Emit CloudWatch PutMetricData API calls for dau, mau, conversion_rate.
- Return a deployment package description (requirements.txt) and IAM policy with least privilege required.
Expected output
Return the Lambda function file, IAM policy JSON, and a sample snapshot JSON.
Prompt 06 — SQL Explainer and Rewriter for Cost Optimization
Use case
Analyze a user-provided SQL query, explain its cost characteristics, and produce an optimized rewritten SQL that limits scan volume, adds predicates, and leverages appropriate partitioning and clustering keys.
System configuration
{
  "model": "code-davinci-002",
  "temperature": 0.0,
  "max_tokens": 1200
}
Variables
| Name | Type | Description | Example |
|---|---|---|---|
| sql_query | string | Original expensive query | SELECT u.*, SUM(p.amount) FROM users u JOIN payments p ON u.id=p.user_id GROUP BY u.id |
| table_metadata | object | Partition keys and table sizes | {“payments”:{“size_gb”:120,”partition_key”:”payment_date”}} |
Execution steps
- Parse SQL and identify full table scans, cross joins, and unbounded aggregations.
- Using table_metadata, suggest predicates (date ranges), incremental approach, approximate aggregations (HyperLogLog for distinct counts), pre-aggregation strategies, and use of clustering keys for frequent filters.
- Return a rewritten SQL that includes date range binds and windowing to limit scanned partitions and an explanation of performance improvement (estimated scan reduction percentage).
Expected output
Return: analysis text, rewritten SQL with bind parameters, and an estimated cost delta (%).
Prompt 07 — Multivariate Time Series Forecasting Scaffold
Use case
Generate a forecasting pipeline scaffold implementing Prophet or ARIMA (depending on data) with exogenous regressors. The output is a Python module that trains, backtests with rolling origin, outputs metrics (MAPE, RMSE), and saves a serialized model artifact for production inference.
System configuration
{
  "model": "code-davinci-002",
  "temperature": 0.0,
  "max_tokens": 2200
}
Variables
| Name | Type | Description | Example |
|---|---|---|---|
| target_ts | string | Column name of target time series | revenue |
| timestamp_col | string | Timestamp column | report_date |
| exog_cols | array[string] | Exogenous regressors | [“marketing_spend”,”holiday_flag”] |
| model_type | string | “prophet” or “arima” or “auto” | auto |
Data schema
Table: analytics.daily_metrics with report_date (date), revenue (numeric), marketing_spend (numeric), holiday_flag (int 0/1).
Execution steps
- Load data into pandas, resample to daily frequency with forward/backward fill rules (explicit strategy).
- Perform stationarity tests (ADF). If non-stationary, difference as needed for ARIMA or rely on Prophet’s trend component.
- Implement cross-validation: rolling-forecast origin, compute MAPE and RMSE and select hyperparameters by grid search.
- Serialize model with joblib and provide a prediction function to generate horizon forecasts and prediction intervals.
- Produce a CI test snippet that asserts forecast RMSE < threshold for acceptance.
Expected output
Python package structure, training script, backtest summary, serialized model path, and forecast JSON example with confidence intervals.
Prompt 08 — Auto-Generated Data Contract Validator
Use case
Produce a JSON Schema validator and a runtime Python utility that runs as a Presto or BigQuery UDF-style validation in batch to enforce data contracts on incoming ETL outputs.
System configuration
{
  "model": "code-davinci-002",
  "temperature": 0.0,
  "max_tokens": 1400
}
Variables
| Name | Type | Description | Example |
|---|---|---|---|
| contract_name | string | Human label for contract | events_v1 |
| rules | object | Schema rules with types and constraints | {…} |
Execution steps
- Generate JSON Schema from rules; create Python function validate_row(row) returning list of violations.
- Create a batch runner that reads parquet, validates rows, writes invalid rows to a quarantine prefix with reasons, and emits metrics for error rates.
- Include a Git-friendly contract file for CI validation; add unit tests that assert the validator behavior on edge cases.
Expected output
Validator code, sample contract JSON, and CI test file (pytest).
Prompt 09 — Ad-hoc Statistical Test Runner for A/B Analysis
Use case
Automate frequentist A/B test analytics: detect winner, compute p-values, confidence intervals, power analysis, and sanity checks (randomization, sample ratio mismatch). Output a notebook-ready Python script performing chi-squared or t-tests as appropriate and a human-readable executive summary.
System configuration
{
  "model": "code-davinci-002",
  "temperature": 0.0,
  "max_tokens": 2000
}
Variables
| Name | Type | Description | Example |
|---|---|---|---|
| variant_col | string | Column denoting treatment/control | variant |
| metric_col | string | Outcome metric | conversion |
| alpha | number | Significance level | 0.05 |
Data schema
Flat table with user_id, variant, conversion (0/1), revenue (numeric), assigned_at (timestamp).
Execution steps
- Run sample ratio test by comparing expected splits to observed assignment proportions using chi-squared.
- Choose two-sample t-test for continuous metrics (revenue) with variance check (Levene test) and chi-squared or z-test for binary metrics.
- Compute p-values and confidence intervals; adjust for multiple comparisons using Bonferroni or Benjamini-Hochberg if >1 metric.
- Return an executive summary recommending ‘Reject’ or ‘Fail to Reject’, effect size, and required sample size for desired power.
Expected output
Notebook script with results dataframe: variant_a, variant_b, delta, ci_lower, ci_upper, p_value, test_type, power_estimate.
Prompt 10 — Interactive Query Builder for Non-SQL Analysts
Use case
Generate a lightweight web interface scaffold that transforms analyst-selected filters and dimensions into safe, parameterized SQL using a DSL. The result is secure, prevents injection, and leverages database parameter binding.
System configuration
{
  "model": "code-davinci-002",
  "temperature": 0.0,
  "max_tokens": 1200
}
Variables
| Name | Type | Description | Example |
|---|---|---|---|
| allowed_dimensions | array[string] | Whitelist of dimensions | [“region”,”product_category”,”platform”] |
| allowed_metrics | array[string] | Whitelist of metrics and corresponding SQL | {“revenue”:”SUM(revenue)”,”orders”:”COUNT(*)”} |
Execution steps
- Produce front-end UI with dropdowns for metrics, dimension selectors, and date pickers.
- On submit, construct a parameterized SQL template: SELECT {dimensions}, {metrics} FROM analytics.daily_metrics WHERE report_date BETWEEN :start_date AND :end_date AND … GROUP BY {dimensions}.
- Implement server-side sanitizer that rejects any request containing non-whitelisted fields.
Expected output
Deliver a web scaffold (HTML + JS) and server code with parameterized DB execution and JSON result formatting.
Prompt 11 — Composite Metric Builder and Derivation Engine
Use case
Allow analysts to define composite metrics as formulas over existing metrics (e.g., ARPU = revenue / active_users). Codex should generate SQL that computes composites safely, handling divide-by-zero and missing data, and produce a lineage manifest mapping derived metrics to base metrics.
System configuration
{
  "model": "code-davinci-002",
  "temperature": 0.0,
  "max_tokens": 1000
}
Variables
| Name | Type | Description | Example |
|---|---|---|---|
| metric_formula | string | Expression using metric identifiers | revenue / NULLIF(active_users,0) |
| metric_name | string | Derived metric name | ARPU |
Execution steps
- Parse formula, validate metric identifiers against allowed metrics, and create SQL using COALESCE/NULLIF to guard against divide-by-zero.
- Generate lineage: JSON mapping derived metric to base SQL and columns.
- Add unit tests using synthetic datasets to assert expected outputs and edge-case handling.
Expected output
SQL for metric derivation and a lineage JSON file suitable for cataloging.
Prompt 12 — Incremental Data Quality Monitor Using SQL
Use case
Produce high-confidence SQL scripts to compute daily data quality metrics: row counts, null rates per column, cardinality estimates, value-domain checks, and drifts vs rolling baseline. Output should include thresholds and a policy file for alerting.
System configuration
{
  "model": "code-davinci-002",
  "temperature": 0.0,
  "max_tokens": 1000
}
Variables
| Name | Type | Description | Example |
|---|---|---|---|
| target_table | string | Table to monitor | warehouse.events_processed |
| dq_thresholds | object | Null rate and cardinality thresholds | {“user_id_null_pct”:0.01} |
Execution steps
- Generate SQL to compute: total_rows, null_pct per column, approx_distinct per key, value-domain violations, and compare metrics against rolling 7-day median. Calculate drift_score using KL divergence or JS divergence for categorical distributions.
- Return an actions JSON listing “alert”, “investigate”, or “OK” per check.
Expected output
SQL script and a sample DQ report JSON with status and remediation hints.
Prompt 13 — Cross-Domain Join Planner (Join Order & Predicate Pushdown)
Use case
Given multiple tables and join conditions, generate optimized join execution plan recommendations, including join ordering, predicate pushdown, and suggestions for broadcast vs partitioned joins for Spark or BigQuery sharded joins.
System configuration
{
  "model": "code-davinci-002",
  "temperature": 0.0,
  "max_tokens": 1500
}
Variables
| Name | Type | Description | Example |
|---|---|---|---|
| tables | object | Table metadata: row_count, size_gb, join_keys | {“users”:{“size_gb”:10,”rows”:1000000}} |
| join_graph | array[objects] | Sequence of joins with predicates | [{“left”:”users”,”right”:”events”,”on”:”user_id”}] |
Execution steps
- Estimate cardinalities using available stats; compute selectivity for predicates.
- Recommend join order minimizing intermediate shuffles: join smallest to largest with high-selectivity filters applied first.
- Provide Spark-specific hints: broadcast join if right.size < 200MB (configurable), or use repartition on join key if both large.
Expected output
Plain-text join plan and optional rewritten SQL with hints (/*+ BROADCAST(t2) */ for Spark).
Prompt 14 — Product Usage Funnel Builder (Automated Cohort Funnel)
Use case
Create an automated funnel analysis that calculates conversion rates across steps and cohorts by signup week, includes retention curves, and outputs both aggregated tables (for dashboarding) and a Vega-Lite visualization spec.
System configuration
{
  "model": "code-davinci-002",
  "temperature": 0.0,
  "max_tokens": 1800
}
Variables
| Name | Type | Description | Example |
|---|---|---|---|
| events_table | string | Event-level table | analytics.events |
| funnel_steps | array[string] | Ordered event types | [“signup”,”activate”,”purchase”] |
| cohort_interval | string | cohort bucketing (week, month) | week |
Execution steps
- Implement SQL to derive first occurrence timestamps per user per funnel step using window functions.
- Compute conversion rates for each cohort and step with time delta filters (e.g., step2 within 7 days of step1).
- Create retention curve table: cohort_week, day_offset, active_users.
- Generate Vega-Lite spec for cohort heatmap and funnel step bar chart.
Expected output
SQL scripts to generate aggregate tables and Vega-Lite specs. Include cardinality reduction recommendations (sample or top-N cohorts) for dashboard performance.
Prompt 15 — Self-Healing Data Pipeline Pattern Generator
Use case
Design a self-healing pipeline pattern that can recover from transient failures: automatic retries with exponential backoff, checkpointing, idempotent outputs, and circuit-breaker behavior. Provide orchestration code (Airflow DAG or Prefect flow).
System configuration
{
  "model": "code-davinci-002",
  "temperature": 0.0,
  "max_tokens": 1600
}
Variables
| Name | Type | Description | Example |
|---|---|---|---|
| task_list | array[string] | Ordered tasks | [“extract”,”transform”,”load”] |
| retry_policy | object | Backoff settings | {“retries”:5,”backoff_factor”:2} |
Execution steps
- Generate an Airflow DAG skeleton with tasks as PythonOperators that implement: checkpointing (by manifest files), idempotent writes (MERGE or dedup on primary key), and retry logic with exponential backoff.
- Add a circuit breaker: if errors exceed threshold in 24 hours, pause the DAG and send an incident.
- Include recovery command to resume from last successful checkpoint.
Expected output
Airflow DAG file, a helper module for checkpointing/manifest management, and a guide for integrating with PagerDuty.
Prompt 16 — KPI Alert Rule Generator with Threshold Auto-Tuning
Use case
Auto-generate alert rules for KPIs with thresholds computed from historic variability (e.g., mean +/- k*SD) and incorporate seasonality adjustments. Produce policy config for alerting engine.
System configuration
{
  "model": "code-davinci-002",
  "temperature": 0.0,
  "max_tokens": 1100
}
Variables
| Name | Type | Description | Example |
|---|---|---|---|
| k | number | Multiplier for SD | 3 |
| seasonality_period | int | Days in season (7 weekly) | 7 |
Execution steps
- Compute rolling baseline using seasonal decomposition (STL) to remove seasonality before computing thresholds.
- Generate alert rule config JSON for alerting engine (PagerDuty/SNS) containing metric name, threshold_expression, severity, and suppression window.
- Provide API example to register the alert rule programmatically.
Expected output
Alert rule JSON and a short script to register it with the alerting service.
Prompt 17 — Feature Store Ingestion Code Generator
Use case
Generate ingestion code for a feature store (e.g., Feast or custom), converting raw ETL outputs into online and offline features, with TTL, primary keys, and monitoring hooks.
System configuration
{
  "model": "code-davinci-002",
  "temperature": 0.0,
  "max_tokens": 2000
}
Variables
| Name | Type | Description | Example |
|---|---|---|---|
| entity_key | string | Primary entity name | user_id |
| feature_defs | array[objects] | Features with type and TTL | [{“name”:”avg_spend_7d”,”type”:”float”,”ttl_days”:30}] |
Execution steps
- Generate a Python ingestion module compatible with Feast or an HTTP push to online store.
- Include offline materialization SQL to compute features in batch and streaming connectors for online updates.
- Add monitoring webhooks to validate feature staleness and drift.
Expected output
Ingestion module and manifest with feature definitions.
Prompt 18 — Automated Looker/Metabase Dashboard Exporter
Use case
Given a set of saved SQL queries, generate the metadata and visualization configuration to automate importing them into Looker or Metabase with parameters and schedule definitions.
System configuration
{
  "model": "code-davinci-002",
  "temperature": 0.0,
  "max_tokens": 1400
}
Variables
| Name | Type | Description | Example |
|---|---|---|---|
| saved_queries | array[object] | SQL queries plus titles and parameter definitions | [{“id”:”q1″,”title”:”Daily Revenue”,”sql”:”…”}] |
Execution steps
- Generate export payloads: LookML snippets or Metabase collection JSON with visualization type mapping and scheduling metadata.
- Include parameter metadata and enforce created_by system user for traceability.
- Provide an API registration script to programmatically create dashboards.
Expected output
JSON payloads ready to POST to Looker/Metabase admin APIs and a mapping table of query -> visualization recommendations.
Prompt 19 — Data Lineage Extractor from SQL Repository
Use case
Scan a repository of SQL files, extract table-level lineage, and produce a DAG representation in JSON (nodes tables/views, edges dependencies) and a Markdown summary. Useful to build catalog ingestion pipelines.
System configuration
{
  "model": "code-davinci-002",
  "temperature": 0.0,
  "max_tokens": 1600
}
Variables
| Name | Type | Description | Example |
|---|---|---|---|
| repo_path | string | Path to SQL files | /repo/sql/ |
| dialect | string | SQL dialect | snowflake |
Execution steps
- Parse SQL files using heuristic parsers or a grammar to detect FROM and JOIN tables and CTE definitions.
- Resolve aliases and CTE expansion to map source tables to target tables/views.
- Produce DAG JSON and a simple visualization hint (DOT format) and a report enumerating upstream dependencies for each view.
Expected output
Lineage DAG JSON and a README.md summarizing critical dependencies and cycles (if any).
Prompt 20 — Lightweight OLAP Cube Generator (Star Schema to Cube)
Use case
Given a star schema (fact and dimension tables), generate SQL to build OLAP cubes and a small API to serve aggregated slices at different granularities. Include recommendations for pre-aggregations and materialized views.
System configuration
{
  "model": "code-davinci-002",
  "temperature": 0.0,
  "max_tokens": 2000
}
Variables
| Name | Type | Description | Example |
|---|---|---|---|
| fact_table | string | Fact table name | sales.fact_orders |
| dimension_tables | array[string] | Dimension names | [“dim_date”,”dim_product”,”dim_customer”] |
Execution steps
- Generate SQL for cubes at different granularities, e.g., daily by product, monthly by region.
- Include configuration for materialized views with refresh frequency and partition keys.
- Generate an API scaffold exposing cube slices with caching headers and a TTL policy.
Expected output
Materialized view DDLs and API skeleton. Include cost estimates per refresh.
Prompt 21 — Privacy-Aware Reporting: Differential Privacy Noise Mechanism
Use case
Produce a reporting pipeline that applies differential privacy (DP) noise to aggregate metrics before publication. Provide configurable epsilon and delta, compute sensitivity, and implement Laplace or Gaussian noise as appropriate.
System configuration
{
  "model": "code-davinci-002",
  "temperature": 0.0,
  "max_tokens": 1800
}
Variables
| Name | Type | Description | Example |
|---|---|---|---|
| epsilon | float | Privacy budget | 1.0 |
| metric_type | string | count/mean/sum | count |
Execution steps
- Compute global sensitivity for metric type (e.g., count sensitivity = 1).
- Generate noise distribution parameters and apply noise to final aggregates.
- Return release policy explaining expected distortion and provide simulated error ranges.
Expected output
Python module implementing DP noise addition and a sample noisy-report JSON.
Prompt 22 — Crosswalk Generator: Mapping Event Properties to a Canonical Schema
Use case
Create a reproducible mapping engine that takes multiple event schemas across platforms (web/mobile/server) and outputs a canonical event schema along with transformation rules and sample mapping functions.
System configuration
{
  "model": "code-davinci-002",
  "temperature": 0.0,
  "max_tokens": 1600
}
Variables
| Name | Type | Description | Example |
|---|---|---|---|
| source_schemas | array[objects] | List of source event schemas | [{“platform”:”web”,”schema”:{…}}] |
| canonical_schema | object | Target canonical event schema | {…} |
Execution steps
- Map keys between schemas using heuristics (exact match, synonyms, regex) and produce explicit transformation rules (rename, type cast, default values).
- Generate code snippets for each platform to transform events to canonical schema in real-time or during batch processing.
Expected output
Crosswalk JSON with mapping rules and per-platform code snippets.
Prompt 23 — Revenue Waterfall Decomposition with Attribution Models
Use case
Implement an attribution pipeline that computes revenue attribution by channels using last-touch, first-touch, and multi-touch (Shapley / Markov) methods, and outputs waterfall reports showing how channel contribution sums to total revenue.
System configuration
{
  "model": "code-davinci-002",
  "temperature": 0.0,
  "max_tokens": 2200
}
Variables
| Name | Type | Description | Example |
|---|---|---|---|
| touchstream_table | string | Table listing user touches and channels | marketing.user_touches |
| attribution_model | string | last/first/shapley/markov | shapley |
Execution steps
- Reconstruct user touch sequences ordered by timestamp per conversion event.
- Implement chosen attribution logic: simple rules for last/first, implement Shapley by enumerating permutations for small channel sets or approximate using sampling.
- Aggregate channel-level attributed revenue and generate waterfall visualization SQL and Vega-Lite spec showing total revenue breakdown.
Expected output
Attribution SQL and a result JSON mapping channel -> attributed_revenue with contribution percentages.
Prompt 24 — Adversarial Query Guard: Detect Expensive Patterns
Use case
Create a static analyser that scans SQL submitted by analysts and flags patterns likely to produce expensive or runaway queries: unbounded joins, SELECT *, cartesian joins, missing WHERE on large tables, or non-equality joins that disable partition pruning.
System configuration
{
  "model": "code-davinci-002",
  "temperature": 0.0,
  "max_tokens": 1200
}
Variables
| Name | Type | Description | Example |
|---|---|---|---|
| sql_text | string | Query to scan | “SELECT * FROM huge_table” |
Execution steps
- Parse SQL and run heuristics: detect SELECT *, missing WHERE with table size > threshold, CROSS JOINs, non-equi joins on big tables, and ORDER BY without LIMIT.
- Return a structured report with severity levels and remediation suggestions (add WHERE, use pre-aggregations, partition filters).
Expected output
JSON with issues array including rule_id, severity, explanation, and code-fix suggestion.
Prompt 25 — BI Data Catalog Entry Generator with Metadata Enrichment
Use case
Automatically generate catalog entries for new tables and views with descriptions, column metadata, sample rows, lineage, and trust scores. Use heuristics and small examples to auto-document.
System configuration
{
  "model": "code-davinci-002",
  "temperature": 0.0,
  "max_tokens": 1600
}
Variables
| Name | Type | Description | Example |
|---|---|---|---|
| table_ddl | string | DDL or schema | “CREATE TABLE… “ |
| sample_rows | array[objects] | Sample data for illustrative descriptions | [{“user_id”:”u1″,”country”:”US”}] |
Execution steps
- Infer human-readable descriptions for table and columns using heuristics and sample values (e.g., “user_id: unique identifier for application users”).
- Compute metrics: row_count estimate, null_pct per column, cardinality, sample rows, and trust score computed from completeness and recent update recency.
- Produce JSON metadata payload compatible with your data catalog API.
Expected output
Catalog JSON with fields: name, description, columns[], sample_rows, lineage, trust_score.
Prompt 26 — Real-time Metric Stream Processor (Kafka + Flink Template)
Use case
Provide a Flink job template that consumes events from Kafka, performs windowed aggregations in real-time, writes results to a materialized metrics topic and an OLAP store, and emits latency metrics.
System configuration
{
  "model": "code-davinci-002",
  "temperature": 0.0,
  "max_tokens": 2000
}
Variables
| Name | Type | Description | Example |
|---|---|---|---|
| kafka_topic | string | Input topic | events |
| window_size | int | Window duration in seconds | 60 |
Execution steps
- Generate a Flink job in Java/Scala that deserializes JSON events, keys by dimension, applies tumbling or sliding windows, computes aggregates, and writes to an output Kafka topic with schema-proto or Avro.
- Include late data handling: side outputs for late events and state TTL.
- Provide monitoring hooks to export processing latency and watermark delays to Prometheus.
Expected output
Flink job source, deployment config, and schema registry entries for the metrics topic.
Prompt 27 — Schema Evolution Assistant for Parquet/Avro
Use case
Automate safe schema evolution for Parquet/Avro datasets: generate migration SQL and reader-writer compatibility checks, including nullable promotions, field deprecations, and renames. Provide rollout plan with progressive reader compatibility tests.
System configuration
{
  "model": "code-davinci-002",
  "temperature": 0.0,
  "max_tokens": 1600
}
Variables
| Name | Type | Description | Example |
|---|---|---|---|
| current_schema | object | Existing Avro schema | {…} |
| proposed_changes | object | Requested field changes | {“add”:”new_field”,”rename”:{“old”:”new”}} |
Execution steps
- Assess backward/forward compatibility using Avro compatibility rules.
- Produce a migration plan: add fields as nullable with defaults, gradual renames via alias, and deprecation steps.
- Generate SQL to write patched versions into staging with tests that compare sample read behavior.
Expected output
Compatibility report and migration SQL scripts plus a test harness to verify compatibility.
Prompt 28 — Automated Reporting Notebook to HTML Exporter
Use case
Convert a Jupyter notebook that performs data analysis into a server-renderable HTML report with static images and interactive Vega-Lite embeds, suitable for scheduled publication to a knowledge base.
System configuration
{
  "model": "code-davinci-002",
  "temperature": 0.0,
  "max_tokens": 1400
}
Variables
| Name | Type | Description | Example |
|---|---|---|---|
| notebook_path | string | Path to .ipynb | /reports/daily_analysis.ipynb |
| output_html | string | Destination HTML path | /var/www/reports/daily.html |
Execution steps
- Use nbconvert to turn notebook cells into HTML; capture Vega-Lite JSONs and inject interactive runtime JS referencing a CDN for Vega libraries.
- Inline critical CSS and minify HTML for fast load.
- Include metadata banner with generation time, executed_by, and data cut date.
Expected output
HTML file and instructions to schedule the conversion as a CI job.
Prompt 29 — Cost Forecasting for Cloud Data Warehouse Usage
Use case
Build a cost forecasting model that ingests historical query scan metrics, growth rates, and proposed new workloads, and projects spend with sensitivity analysis. Provide recommendations to optimize cost: materialized views, partition pruning, reservation sizing.
System configuration
{
  "model": "code-davinci-002",
  "temperature": 0.0,
  "max_tokens": 2200
}
Variables
| Name | Type | Description | Example |
|---|---|---|---|
| historical_usage | array[objects] | Daily scan bytes and cost | [{“date”:”2026-06-01″,”scan_bytes”:123456789,”cost”:12.34}] |
| growth_scenarios | array[number] | Monthly growth rates to model | [0.02,0.05] |
Execution steps
- Fit a time-series model (multiplicative trend + seasonality) to scan_bytes; project forward based on growth scenarios.
- Translate scan_bytes to cost using pricing model (per TB scanned) and suggest mitigation actions with estimated savings.
- Generate a sensitivity table with best/expected/worst-case costs over next 12 months.
Expected output
Forecast CSV, sensitivity table, and a one-page executive recommendation summarizing cost-saving opportunities and estimated savings.
Prompt 30 — End-to-End “Analyst to Production” Workflow Scaffold
Use case
Provide a complete workflow scaffold that maps an analyst’s exploratory notebook into production artifacts: tested SQL, CI pipeline, scheduled job, dashboards, and monitoring. The scaffold should be opinionated about environments (dev/staging/prod), review gating, and rollout procedures.
System configuration
{
  "model": "code-davinci-002",
  "temperature": 0.0,
  "max_tokens": 2600
}
Variables
| Name | Type | Description | Example |
|---|---|---|---|
| notebook | string/path | Analyst notebook | /home/analyst/experiment.ipynb |
| production_target | string | Target table or dashboard | analytics.daily_summary |
| reviewers | array[string] | List of code reviewers | [“data-eng”,”analytics-lead”] |
Data schema
Assume exploratory datasets with mixed types; the scaffold must create typed DDL for production tables.
Execution steps
- Extract SQL and transformation logic from notebook cells and isolate the transformation as a single parameterized SQL or Python ETL script.
- Generate unit tests using synthetic datasets that cover edge cases and ensure idempotency.
- Create CI pipeline: run tests, lint SQL, perform cost estimation, and deploy to staging if tests pass.
- Provide rollout instructions: preview in staging dashboard, run shadow queries in production, promote to scheduled job (Airflow), and enable monitoring + alerts for data quality regressions.
- Generate change metadata for catalog entry and a runbook for operations on failure.
Expected output
Full directory scaffold (transforms/, tests/, ci/, deploy/), sample CI config (GitHub Actions), Airflow DAG, and runbook.md.
Appendix: Prompt Engineering Patterns and Best Practices for Production
This appendix distills operational patterns used across the 30 prompts above. Use these as general rules when designing prompts for Codex or similar models to produce production-grade code and artifacts.
1. Deterministic configuration
Always set temperature=0.0 (or near-zero) when asking for executable artifacts to minimize hallucination. Use max_tokens conservatively and split tasks into smaller prompts if necessary.
2. Provide precise schemas
Supply JSON Schema or DDL for data expected. The model must see concrete types and required fields to produce robust validation and code.
3. Use variables and parameterization
Design prompts to accept variables for environment-specific values. Avoid hard-coded credentials — instead instruct the model to reference environment variables or secret managers.
4. Request test cases
Always ask the model to include unit tests or small validation datasets. Tests reduce risk when moving artifacts to production.
5. Include integration contracts
Ask for explicit integration snippets: how to call the script, CLI parameters, expected return codes, and manifest locations. This eases automation into pipelines.
6. Safety and governance
Require the model to generate IAM policies (least privilege), data masking for PII, and privacy-preserving defaults (e.g., DP where applicable).
7. Edge-case specifications
Demand explicit handling for low-sample scenarios, nulls, schema drift, and large cardinalities. The model should surface “confidence” levels for results.
8. Incremental deployment guidance
For any production artifact, require a rollout plan: staging validation, shadow testing, gating rules, and rollback steps.
9. Observability hooks
Prompt for Prometheus metrics, structured logs, and alerting integration. Instrumenting early saves debugging time in production.
10. Idempotency and atomic writes
Enforce idempotent operations: manifests, atomic directory swaps, MERGE semantics, or use transactional tables where supported.
Practical Invocation Template
Use this invocation pattern to send any of the above prompts to Codex. Substitute variables and embed the appropriate data schema.
{
  "model": "code-davinci-002",
  "prompt": "",
  "temperature": 0.0,
  "max_tokens": 2000,
  "top_p": 1.0
}
For chat-style models, frame a system message like: “You are an enterprise data engineer assistant that outputs production-grade code and infrastructure artifacts. Validate input schemas and always produce tests.” Then include the detailed user prompt with the variables.
Example: Minimal Production Prompt
Below is a compact example demonstrating the structure to request a daily aggregation script with anomaly detection. Use this as a template and expand per the blueprints above.
System: You are an assistant that returns production-ready Python ETL code and tests. Validate schemas and include error handling.

User:
Use case: Generate an ETL script to compute daily revenue by region and detect anomalies vs a 14-day rolling baseline.

Variables:
report_date=2026-06-20
source_table=analytics.sales_transactions
target_table=analytics.daily_revenue
currency=USD

Schema: { "transaction_id": "string", "timestamp":"datetime", "region":"string", "units":"int", "unit_price":"float", "currency":"string" }

Requirements:
- Use pandas or Spark depending on partition size.
- Normalize currency using exchange_rates table.
- Output: Python script, unit test, manifest.json, Vega-Lite spec for anomalies.

### END
Resources & Further Reading
Operationalize these prompts by integrating with your CI/CD, secret management, and orchestration platforms. For deeper reference designs on observability, schema evolution, and privacy, consult your internal platform docs and open-source resources. You can also assemble modular blocks from the prompts above into composite generator flows.
Teams building automated reporting pipelines should also consider how enterprise-grade analytics platforms can provide the governance layer needed for production deployments. For a deeper exploration of this topic, see our comprehensive guide on 50 GPT-5.5 Prompts for Customer Success Managers: Churn Prediction, Onboarding Workflows, Health Scoring, and Renewal Strategy, which provides actionable frameworks and implementation strategies for enterprise teams.
To implement dashboards and API scaffolds, consider the patterns in Prompt 04 and Prompt 03. For cataloging and lineage, combine Prompt 19 and Prompt 25.
The integration patterns described in this masterclass work seamlessly with existing Codex workflows, enabling teams to connect data analysis outputs to broader automation chains. For a deeper exploration of this topic, see our comprehensive guide on Microsoft Copilot Now Uses GPT-5.5: How the New Model Choice and Browser Automation Features Change Enterprise Productivity, which provides actionable frameworks and implementation strategies for enterprise teams.
Access 40,000+ AI Prompts for ChatGPT, Claude & Codex — Free!
Subscribe to get instant access to our complete Notion Prompt Library — the largest curated collection of prompts for ChatGPT, Claude, OpenAI Codex, and other leading AI models. Optimized for real-world workflows across coding, research, content creation, and business.
Closing notes
This masterclass is intended as a practical factory of prompt blueprints for Codex-driven analytics automation. Each prompt is deliberately precise and prescriptive to minimize ambiguous output and to make the artifacts directly deployable into engineering pipelines. Treat generated code as scaffolding — run tests, add security reviews, and integrate with your release processes before production rollout.
If you need bespoke, domain-specific variants of any of these prompts (e.g., for retail, healthcare, or ad-tech), adapt the schemas and variable lists and re-run the prompt to produce specialized code and integrations.
End of Codex Data Analysis Masterclass.