The Enterprise Guide to OpenAI Spend Controls and Usage Analytics: How to Monitor, Optimize, and Govern AI Costs Across Your Organization in 2026

The Enterprise Guide to OpenAI Spend Controls and Usage Analytics: How to Monitor, Optimize, and Govern AI Costs Across Your Organization in 2026
Executive summary: By 2026, enterprise AI spend is a first-order financial and operational risk. OpenAI’s evolved credit-based billing model combined with its new credit usage analytics and spend controls offers tight guardrails and granular visibility — but only if IT leaders and finance teams design robust policies, operationalize attribution, and integrate those controls into existing FinOps and governance workflows. This guide provides a detailed, actionable playbook for configuring dashboards, allocating budgets, tracking per-team costs, configuring alerts and automations, and building ROI measurement frameworks that produce predictable cost outcomes and demonstrable business value.
Why AI Spend Management Matters in 2026
Large language models and associated services are both variable and high-velocity: cost accrues with tokens, embeddings, fine-tune compute hours, and other metered actions. The 2026 generation of OpenAI features introduces organization-level credit pools, per-project credit allocations, deterministic cost attribution via usage labels, and programmatic budget enforcement APIs. Enterprises that fail to govern these mechanisms face runaway costs, poor model selection, and difficulty demonstrating ROI to finance teams.
Key drivers for disciplined spend control:
- Scale: thousands of users or API keys can generate millions of small charges per hour.
- Variety: different models, streaming vs non-streaming, embeddings, and fine-tuning all have different cost profiles.
- Velocity: costs can spike due to model misconfiguration, feedback loops, or a bad release.
- Governance: regulatory and compliance teams require traceable chargebacks and model decision audit trails.
Core Concepts: Credits, Allocation Units, and Cost Attribution
OpenAI’s 2026 billing model revolves around credits, where a credit represents a fractional unit of monetary value applied to metered operations. Enterprises must map credits to traditional accounting constructs (USD, EUR) and to organizational constructs (cost centers, projects). This section defines the core vocabulary used throughout the guide.
- Credit Pool: A centralized account-level balance of OpenAI credits managed by the billing owner.
- Allocation: A subset of credits assigned to a billing group, team, or project with optional expiration and rollover rules.
- Usage Label: Tags applied to API calls or keys (e.g., team=fraud, app=chatbot) used to attribute costs.
- Meter: A usage category (tokens_input, tokens_output, embedding_calls, fine_tune_hours) each with a credits-per-unit rate.
- Soft Cap vs Hard Cap: Soft caps generate alerts and automated rate-limiting recommendations; hard caps enforce blocking or pausing of a resource.
- Showback vs Chargeback: Showback reports costs; chargeback applies formal internal billing entries.
High-Level Architecture for Enterprise AI Cost Governance
A sustainable architecture combines native OpenAI controls with your enterprise telemetry and FinOps stack. The recommended architecture has three layers:
- Control Layer: OpenAI credit pool, allocations, and enforcement APIs. Contains policy definitions, budgets, soft and hard caps, and per-project controls.
- Telemetry Layer: Centralized collection of usage logs, ingestion into a data warehouse (BigQuery, Snowflake, Azure Synapse), enrichment with organizational metadata, and time-series store for alerts.
- Action Layer: Automation and incident systems (workflows, ticketing, automated API key revocation, throttling) plus FinOps reporting and chargeback integrations with ERP/GL systems.
Operational flow: API calls -> OpenAI metering (credits consumed, labels) -> real-time events + batch logs -> central ingestion -> data warehouse aggregation -> dashboards & alerts -> automated enforcement & chargeback.
Setting Up the OpenAI Spend Dashboard: Step-by-Step
Goal: a single-pane-of-glass dashboard that shows organization-wide credit burn, per-team attribution, forecasted spend, model cost breakdown, and active budget alerts. This section covers the required OpenAI settings, data collection, data model, and dashboard KPIs.
1) Configure OpenAI account and allocation structure
Steps:
- Design the allocation hierarchy: Organization -> Billing Group -> Department -> Team -> Project/Application.
- Create allocation pools in OpenAI for each Billing Group with defined monthly credit amounts, rollover policies, and expiration windows.
- Define service accounts and limit the number of API keys per project. Enforce policies that API keys must include usage labels (team, cost_center, project, environment).
Example naming convention for allocations and labels:
- Allocation ID: org-1234-bg-payments
- Usage labels: team=payments, project=auth-service, environment=prod
2) Ingest and normalize logs into your data lake
OpenAI emits both real-time usage events (webhooks / streaming) and batch ingestion endpoints (daily usage exports). You should collect both.
Essential fields to ingest:
- timestamp
- request_id
- api_key_id
- model_name
- operation_type (completion, embedding, fine_tune, file_upload)
- units_consumed (tokens, requests, seconds)
- credits_consumed
- usage_labels (team, cost_center, project, environment)
- response_latency_ms and error_code
Sample BigQuery table schema (columns):
timestamp TIMESTAMP,
request_id STRING,
api_key_id STRING,
model_name STRING,
operation_type STRING,
units_consumed FLOAT,
credits_consumed FLOAT,
usage_labels STRUCT,
response_latency_ms INT64,
error_code STRING
3) Enrich with organizational metadata
Join raw usage with authoritative organizational sources (HR, CMDB, cost center table). This enables consistent chargeback mappings and SLA enforcement.
Sample join keys: api_key_id -> application owner; team label -> cost center ID.
4) Define KPIs and dashboard tiles
Recommended KPIs and how to compute them:
- Total credits consumed (last 24h / 7d / 30d) = SUM(credits_consumed) grouped by time window.
- Credits per model = SUM(credits_consumed) WHERE model_name = X.
- Credits per team = SUM(credits_consumed) GROUP BY usage_labels.team.
- Cost per inference = SUM(credits_consumed) / COUNT(request_id) for operation_type=completions.
- ROI per project (see ROI section for formula) displayed as percentage and payback days.
- Forecasted burn = time-series forecast from last N days (simple exponential smoothing or ARIMA) to predict monthly burn.
5) Build the dashboard
Implementation options: Grafana (with BigQuery plugin), Looker, Power BI, or a homegrown front end. Use pre-aggregated materialized views for performance and a real-time tile powered by streaming events for alerts.
Architecture diagram snippet (conceptual):
- Event stream -> Pub/Sub/Kafka -> real-time processor (Flink/Kinesis) -> alerts
- Batch exports -> Data warehouse -> BI dashboards & reports
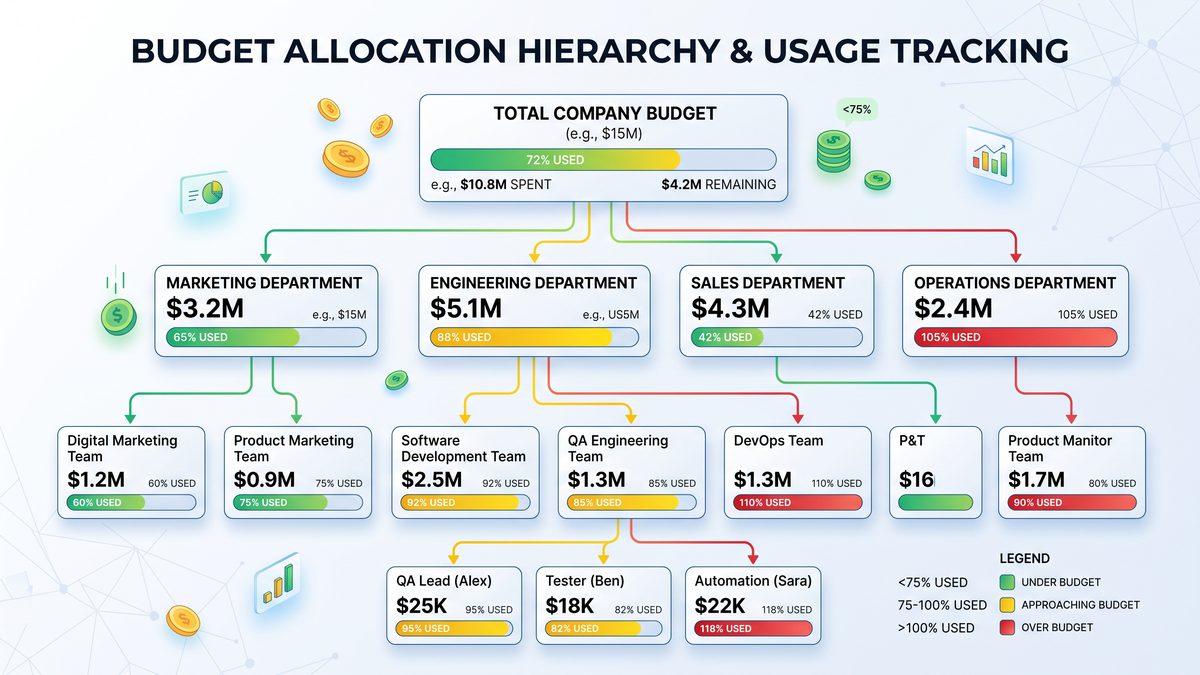
Spend Control Hierarchy: Recommended Design
Enterprises should standardize the hierarchy and enforcement model. Below is a canonical structure and recommended policy behavior at each level. Use programmatic APIs to automate creation and enforcement.
| Hierarchy Level | Responsible Owner | Control Type | Typical Policies | Enforcement Options |
|---|---|---|---|---|
| Organization | Central Finance / Cloud Finance | Credit Pool & Allocation Rules | Pool size, rollover policy, default hard cap | Hard cap (stop new allocations), global alerts |
| Billing Group | Business Unit Finance | Monthly Allocation | Allocate credits per BU, define conversion rate to USD | Soft caps, automated scaling suggestions |
| Department / Team | Team Lead / Engineering Manager | Sub-Allocation & Tagging | Tag enforcement, model whitelists, environment rules | Rate-limiting, alerting, short-term throttles |
| Project / Application | Product Manager / App Owner | Project Budget | Monthly project credits, cost per feature SLAs | Soft cap alerts, automated key rotation |
| API Key / User | Dev Owner | Daily Limits & Tokens | Per-key request limits, environment isolation | Immediate throttle / block |
Policy and enforcement recommendations
1) Centralize allocation creation under finance to ensure consistent conversion rates and rollover defaults.
2) Enforce tag requirement at API key issuance: keys without required tags are disabled.
3) Prevent product teams from exceeding monthly allocation by implementing both soft and hard caps (soft caps for warnings and autoscaling suggestions; hard caps to stop runaway use in emergencies).
4) Adopt a separation of duties: authorization for allocation changes should require both finance and engineering approvers.
Budget Allocation Strategies
Allocating credits effectively across an enterprise requires a mix of top-down and bottom-up planning. Use a hybrid approach:
- Top-down: Finance sets overall budget envelope based on strategic priorities and historical burn.
- Bottom-up: Teams submit forecasted consumption based on anticipated model usage, inference volumes, and product launches.
- Iterate monthly: Reconcile forecasts vs actuals and adjust allocations for next month.
Allocation Methods
- Flat allocation: Equal credits per team. Simple but inefficient.
- Usage-weighted allocation: Historical credits scaled to expected growth rates.
- Business-value allocation: Allocate based on projected revenue or cost savings attributed to AI features (best for high-value initiatives).
- Hybrid reserve: Reserve a central pool for experimentation; allocate the remainder to production teams.
Sample allocation policy table
| BU | Monthly Credits | Rollover | Reserve Pool | Approval Owner |
|---|---|---|---|---|
| Payments | 500,000 | Up to 10% | 50,000 | Head of Payments Finance |
| Customer Support | 300,000 | No Rollover | 30,000 | Customer Ops Finance |
| R&D / Experimentation | 200,000 | Up to 50% | 100,000 | Head of R&D |
Per-Team Cost Tracking: Implementation Patterns
High-fidelity cost attribution is achieved by combining API-side labels with server-side enforcement and data enrichment. Below are three implementation patterns, increasing in fidelity and complexity.
Pattern A: Tag-only attribution (Low friction)
Require developers to attach usage labels to every API call. Aggregate usage by label. Pros: fast to implement. Cons: vulnerable to untagged or mislabeled traffic.
Pattern B: API gateway enforcement (Moderate complexity)
All requests pass through an API gateway that injects canonical tags based on authenticated identity, and enforces per-key rate limits. Gateway logs are ingested for attribution, and gateways enforce tag immutability.
Pattern C: Key-to-cost-center mapping (High fidelity)
Issue short-lived keys per environment that are mapped to cost centers in a central registry. Enforce tag compliance at issuance time. This supports precise chargeback and automated deprovisioning on team offboarding.
Sample BigQuery SQL to compute credits per team
-- Credits per team for last 30 days
SELECT
  usage_labels.team AS team,
  SUM(credits_consumed) AS credits_consumed_30d,
  COUNTIF(operation_type='completion') AS completion_count_30d,
  ROUND(SUM(credits_consumed) / NULLIF(COUNTIF(operation_type='completion'), 0), 6) AS credits_per_inference
FROM
  `project.dataset.openai_usage`
WHERE
  timestamp >= TIMESTAMP_SUB(CURRENT_TIMESTAMP(), INTERVAL 30 DAY)
GROUP BY
  team
ORDER BY
  credits_consumed_30d DESC;
Alert Configuration and Automated Responses
Alerting principles:
- Alert on leading indicators (rate of change, model-specific surge) rather than lagging totals only.
- Use multiple channels: email to finance, Slack to engineering on-call, webhook to automation engine, and pager for critical incidents.
- Differentiate alert severity based on business impact and whether the resource is production.
Alert tiers and actions
| Alert Level | Trigger Threshold | Recipients | Automated Action | Notes |
|---|---|---|---|---|
| Info | >= 50% of daily burn forecast | Team Slack channel | None | Advisory only |
| Warning | >= 70% of monthly budget | Team Lead, BU Finance | Generate ticket, suggest optimizations | Requires acknowledgement in 24h |
| Critical | >= 90% of monthly budget or 20% MoM spike | Ops On-call, BU Head, Central Finance | Apply rate limit to non-prod keys, suggestions for model downgrades | Immediate mitigation required |
| Hard Cap Enforcement | >= 100% of monthly allocation | Central Finance, Exec Sponsor | Automatic block on API keys or requests for specific allocation | Escalation to manual override process |
Alert configuration examples
JSON webhook payload to automation engine that triggers a throttle action when a critical threshold is met:
{
  "event": "spend.alert",
  "severity": "critical",
  "allocation_id": "org-1234-bg-payments",
  "threshold": 0.9,
  "current_usage": 451200,
  "monthly_allocation": 500000,
  "action": {
    "type": "rate_limit",
    "params": {
      "scope": "non-prod",
      "max_rps": 10
    }
  },
  "notify": ["[email protected]", "#payments-ops"]
}
Automated enforcement should be governed by formal runbooks and an override process with multi-party approval to avoid disrupting critical operations.
Optimization: Reducing Credit Burn Without Sacrificing Value
Optimization is about choosing the right model, batching requests, caching, token economy, and model lifecycle management. The following levers produce predictable wins:
- Model selection: Use smaller models for low-complexity tasks; reserve larger models for generation tasks requiring higher fidelity. Implement model whitelists and provide cost-effective default models.
- Prompt engineering for token efficiency: Reduce context length, reuse system prompts, summarize historical conversation states to shorter representations, and trim unnecessary tokens.
- Caching and memoization: Cache deterministic responses (embeddings, repeated queries) and use delta updates for stateful sessions.
- Batching: Batch embedding or classification calls to reduce per-request overhead.
- Fine-tune vs prompt engineering: Analyze cost vs accuracy for fine-tuning; for heavy repeated tasks, fine-tuning can reduce inference cost if it reduces tokens or calls.
- Session management: For chat sessions, persist condensed conversation state instead of full history when feasible.
- Feature gating: Dynamically disable non-critical features when nearing budget thresholds.
Optimization scorecard
| Optimization Lever | Expected Savings | Implementation Complexity | Ownership |
|---|---|---|---|
| Model right-sizing | 10-40% | Low | ML Platform |
| Prompt token reduction | 5-30% | Medium | Product / ML |
| Caching common responses | 10-70% | Medium | Application Engineering |
| Batch embedding requests | 20-50% | Low | Search/IR Team |
Chargeback and Showback Models
Finance and IT must agree whether to show costs (inform) or charge directly (transfer) to business units. Both models require precise attribution data and a reconciliation cadence.
Showback
Showback is transparency without formal invoices. Use monthly reports with drilldowns by team and project. Showback is recommended during the experimentation phase to avoid resistance to innovation.
Chargeback
Chargeback assigns costs to internal GL accounts and often involves journal entries. For chargeback:
- Establish a mapping: usage_labels.cost_center -> GL account
- Export monthly totals and create standard journal entries
- Include variance explanations for overruns and apply cross-charges for shared central services
Forecasting and Budget Reconciliation
Accurate forecasting combines historical burn and business event schedules. Implement a rolling 90-day forecast and reconcile weekly with actuals.
Forecasting approach
- Compute daily burn rate per team and model for the last 90 days.
- Incorporate planned releases with estimated incremental calls per release.
- Model scenarios: baseline, expected, and surge. Assign confidence levels to each.
- Run stress tests: simulate a 2x or 5x spike in requests for 48 hours to examine allocation limits and fallback behavior.
Sample forecast metric: Projected monthly credits = Current month-to-date credits + (average daily burn last 14 days * remaining days) +/- release adjustments.
ROI Measurement Frameworks and Concrete Formulas
Measuring AI ROI in enterprises requires linking cost to measurable benefits: revenue lift, cost savings, throughput gains, error reduction, or risk reduction. Below are concrete formulas and examples for calculating enterprise AI ROI.
Core ROI formulas
| Metric | Formula | Notes |
|---|---|---|
| Straight ROI | (Total Benefit – Total Cost) / Total Cost | Expressed as a decimal or percentage. |
| Payback Period (days) | Initial Investment / Daily Net Benefit | Time to recoup the investment. |
| Cost per Incremental Unit | Total AI Cost / Incremental Units Delivered | Units: revenue transactions, resolved tickets, leads qualified. |
| Net Present Value (NPV) | SUM[(Benefit_t – Cost_t) / (1 + r)^t] over t | Discount future benefits at rate r. |
| Incremental Revenue Attribution | (Revenue_with_AI – Revenue_without_AI) – Cost_of_AI | Requires A/B tests or holdout groups for accuracy. |
Practical metrics for AI initiatives
- Cost per resolved ticket (customer support): Total AI credits used / tickets resolved by AI.
- Cost per qualified lead (sales): Total AI credits used in lead enrichment / number of leads qualified.
- Operational cost reduction: (Baseline FTE hours * FTE cost) – AI operational cost.
Example ROI calculation: AI-powered support chatbot
Inputs:
- Monthly AI cost (credits -> USD): $35,000
- Monthly support tickets handled by AI: 25,000
- Agent labor cost per ticket (baseline): $5
- Average ticket handling time saved: 3 minutes (0.05 hours), agent fully loaded cost per hour: $50
- Incremental revenue or retention impact: $0 (not considered)
Calculations:
- Labor saved per ticket = 0.05 hours * $50 = $2.50
- Total labor savings = 25,000 * $2.50 = $62,500
- Net benefit = $62,500 – $35,000 = $27,500
- Straight ROI = $27,500 / $35,000 = 0.7857 => 78.57%
- Payback period for setup costs (if initial investment $50,000) = $50,000 / $27,500 ≈ 1.82 months
Attribution best practices
1) Use randomized controlled trials when possible (A/B tests, holdout cohorts).
2) When direct experiments aren’t possible, use difference-in-differences or propensity score matching to estimate incremental impact.
3) Adjust for seasonality and product cycles.
4) Include the full cost stack: credits, storage, index costs, data engineering, and model ops labor when calculating total cost of ownership (TCO).
Effective spend governance becomes critical as organizations scale from pilot deployments to company-wide AI adoption, particularly when managing thousands of concurrent users. For a deeper exploration of this topic, see our comprehensive guide on Gemini 3.1 Pro vs Claude Sonnet 4.6 for Enterprise Deployments: Which Should You Choose in 2026?, which provides actionable frameworks and implementation strategies for enterprise teams.
Operationalizing Governance: Roles, Policies, and Review Cadence
Successful governance requires explicit roles and a lightweight committee structure with clear decision rights. Adopt a monthly cadence for budgeting and a quarterly cadence for policy and model portfolio review.
Suggested roles and responsibilities
- Chief AI Officer / Sponsor: Strategic oversight and budget sign-off.
- Central FinOps Lead: Manages credit pools, reconciles invoices, oversight of chargebacks.
- AI Platform Owner: Implements technical controls, API key issuance, and audit trails.
- Product / Team Leads: Request allocations, own optimization and cost within allocations.
- Security & Compliance: Approves model governance policies and access reviews.
- Model Risk Committee: Quarterly review of model performance, cost, and safety metrics.
Governance calendar
| Cadence | Activity | Participants | Output |
|---|---|---|---|
| Daily | Health and major alerts | Ops, On-call | Incident tickets |
| Weekly | Budget burn review, forecast adjustments | Team Leads, FinOps | Allocation tweaks |
| Monthly | Chargeback / Showback reports, invoicing | Finance, Central AI | Journal entries, reports |
| Quarterly | Model portfolio review, ROI deep-dive | Exec Sponsor, Model Risk Committee | Policy updates, significant re-allocations |
Integration: Linking OpenAI Spend to Enterprise Financial Systems
To make AI costs actionable in a broader finance workflow, export monthly CSVs or direct integrations into ERP systems. Map OpenAI line items (credits consumed by allocation and meter) to GL accounts.
Integration patterns:
- Daily ETL job that aggregates by GL mapping and writes into a staging table for finance.
- Automated journal generation with human approval for chargeback entries above a threshold.
- Attach invoice IDs and allocation IDs to ERP entries for auditability.
Security and Compliance Considerations
Spend controls must be paired with security controls. Key requirements:
- Rotate API keys periodically and enforce least-privilege via scoped keys.
- Encrypt usage logs and protect access to dashboards with role-based access control (RBAC).
- Ensure labels are immutable once set by enforcement gateway to prevent cost evasion.
- Retain detailed logs for auditing periods required by regulation (e.g., 7 years for certain industries).
Case Studies and Playbook Examples
Below are anonymized scenarios that demonstrate practical application of the strategies described.
Case study 1: Retail Conversational Agent
Situation: A global retailer launched a generative shopping assistant. Costs rose rapidly due to long context windows and large model choice.
Actions:
- Implemented model tiering: default to a mid-sized model, escalate to a large model only when high-confidence retrievals failed.
- Added session summarization to reduce historical tokens.
- Introduced caching for catalog queries and product details.
- Set soft cap alerts at 70% and hard cap at 100% for the BU allocation.
Result: 42% reduction in monthly credits and improved latency for core interactions.
Case study 2: Banking Fraud Detection
Situation: The fraud team used embeddings for every transaction at scale; costs were predictable but high.
Actions:
- Switched to incremental embedding strategy: only new or changed transactions were embedded.
- Re-architected retrieval to use approximate nearest neighbor indices to reduce embedding calls.
- Implemented chargeback to the fraud detection GL account for visibility.
Result: 62% reduction in embedding-related credits and a demonstrable cost-per-fraud-detection improvement.
Practical Runbook: What to Do When Cost Spikes
- Identify spike source: query logs for top-consuming API keys, models, and endpoints in last 15 minutes.
- Triangulate ownership: map API keys to team owners and cost centers.
- Mitigate immediate risk: enable pre-configured throttles on non-prod keys; apply targeted rate limits via gateway.
- Escalate: notify finance if usage threatens the allocation.
- Root cause analysis: review recent deploys, model changes, or data pipeline issues that created traffic spikes.
- Remediate: rollback or patch offending deploy; implement preventive controls.
- Post-incident: update the forecast and policies; schedule a retro with stakeholders.

Data Models and Sample Queries for Common Reports
Essential materialized views and their purpose:
- mv_credits_by_team (daily aggregation per team, model)
- mv_model_costs (monthly cost per model)
- mv_request_summary (latency, errors by endpoint)
- mv_forecast_inputs (historical burn + release calendar)
Sample BigQuery query: top 10 cost drivers this week
SELECT
  model_name,
  usage_labels.team AS team,
  SUM(credits_consumed) AS credits_week,
  COUNT(*) AS request_count
FROM
  `project.dataset.openai_usage`
WHERE
  timestamp >= TIMESTAMP_SUB(CURRENT_TIMESTAMP(), INTERVAL 7 DAY)
GROUP BY
  model_name, team
ORDER BY
  credits_week DESC
LIMIT 10;
Sample query: anomaly detection for sudden cost increases
WITH daily AS (
  SELECT
    DATE(timestamp) AS day,
    usage_labels.team AS team,
    SUM(credits_consumed) AS credits
  FROM `project.dataset.openai_usage`
  WHERE timestamp >= TIMESTAMP_SUB(CURRENT_TIMESTAMP(), INTERVAL 60 DAY)
  GROUP BY day, team
),
stats AS (
  SELECT
    team,
    AVG(credits) AS mean_credits,
    STDDEV(credits) AS std_credits
  FROM daily
  WHERE day BETWEEN DATE_SUB(CURRENT_DATE(), INTERVAL 30 DAY) AND DATE_SUB(CURRENT_DATE(), INTERVAL 1 DAY)
  GROUP BY team
)
SELECT
  d.day,
  d.team,
  d.credits,
  s.mean_credits,
  s.std_credits,
  (d.credits - s.mean_credits) / NULLIF(s.std_credits, 0) AS z_score
FROM daily d
JOIN stats s USING(team)
WHERE (d.credits - s.mean_credits) / NULLIF(s.std_credits, 0) > 3
ORDER BY z_score DESC;
Vendor and Contract Negotiation Considerations
When purchasing credits or negotiating terms with OpenAI in 2026, consider:
- Volume discounts by committed monthly credits.
- Reserve pools for unpredictable spikes with negotiated upper limits.
- Data residency and compliance clauses when embedding and storing vectors.
- Credits conversion and expiration terms (routinely negotiate rollover policies).
- SLAs for billing transparency, usage data latency, and support response times for billing incidents.
Checklist: Implementation Steps for the First 90 Days
- Establish central allocation pool and initial per-BU allocations.
- Define tagging standard and update API key issuance workflow to require tags.
- Implement streaming event ingestion and a daily export into your data warehouse.
- Build an initial dashboard with top-level KPIs and a team-level cost tile.
- Configure alert tiers and test the automation that executes rate limits in a non-disruptive way.
- Run a forecasting model and reconcile allocations for the next month.
- Define showback vs chargeback policy and test a pilot with 2-3 teams.
Common Pitfalls and How to Avoid Them
- Relying solely on developer-applied tags — enforce via gateway/key issuance.
- Setting hard caps without an override and rollback process — keep a controlled manual override path and emergency credit buffer.
- Ignoring model-level telemetry — tag cost by model version to identify regressions.
- Mixing experimental and production traffic on the same keys — use separate allocations and keys per environment.
Conclusion: Toward Predictable, Measurable AI Investment
OpenAI’s credit usage analytics and spend controls provide enterprises with the primitives for strong cost governance — but achieving predictability requires deliberate design: enforceable tagging, allocation hierarchies, integrated telemetry, automated alerts and enforcement, and a finance-integrated chargeback model. Combine these controls with engineering optimizations and rigorous ROI measurement so your organization can scale AI responsibly and sustainably.
Next steps for IT leaders:
- Approve the allocation hierarchy and tag standard.
- Implement ingestion and dashboarding within 30 days to establish baseline visibility.
- Run an optimization pilot focusing on model right-sizing and caching to validate savings.
- Operationalize monthly chargeback pilots and finalize SLA and escalation runbooks.
Teams that successfully manage AI costs often combine spend controls with productivity measurement to demonstrate clear return on investment. For a deeper exploration of this topic, see our comprehensive guide on 7 Best AI Coding Agents for automation Compared u2014 Features, Pricing, Use Cases, which provides actionable frameworks and implementation strategies for enterprise teams.
Access 40,000+ AI Prompts for ChatGPT, Claude & Codex — Free!
Subscribe to get instant access to our complete Notion Prompt Library — the largest curated collection of prompts for ChatGPT, Claude, OpenAI Codex, and other leading AI models. Optimized for real-world workflows across coding, research, content creation, and business.
Appendices
Appendix A — Template: Allocation Policy
Allocation Policy (template)
- Allocation ID:
- Owner:
- Monthly Credits:
- Rollover:
- Hard Cap (% of monthly):
- Soft Cap (% of monthly):
- Cost Center (GL):
- Approved Products/Models:
- Enforcement Actions:
- Contacts:
Appendix B — Example Runbook for Hard Cap Override
Hard Cap Override Runbook
1) Incident raised automatically when allocation >= 100%
2) Finance Lead notified
3) Engineering Lead assesses criticality (production impact?)
4) If critical, request temporary top-up from central pool (requires 2 approvals: Finance + Eng)
5) Central pool top-up authorized -> update allocation via API -> incident resolved
6) Postmortem & policy update
Appendix C — Glossary
- Credit: Unit used for billing and allocation.
- Allocation: Assigned subset of credits.
- Soft cap: Non-blocking threshold that triggers alerts.
- Hard cap: Blocking threshold that prevents further consumption without override.
- Showback: Reporting cost back to consumers without financial transfer.
- Chargeback: Transfer of cost to an internal GL account.
Prepared by: Enterprise AI Architecture & FinOps Practice — Recommended next step: pilot the dashboard with one high-variance BU to validate tagging, alerts, and automated enforcement within 30 days.