
How to Speed Up AI Coding Between Prompts: Complete Guide to Eliminating Context Switching, Copy-Paste, and Tool Fragmentation
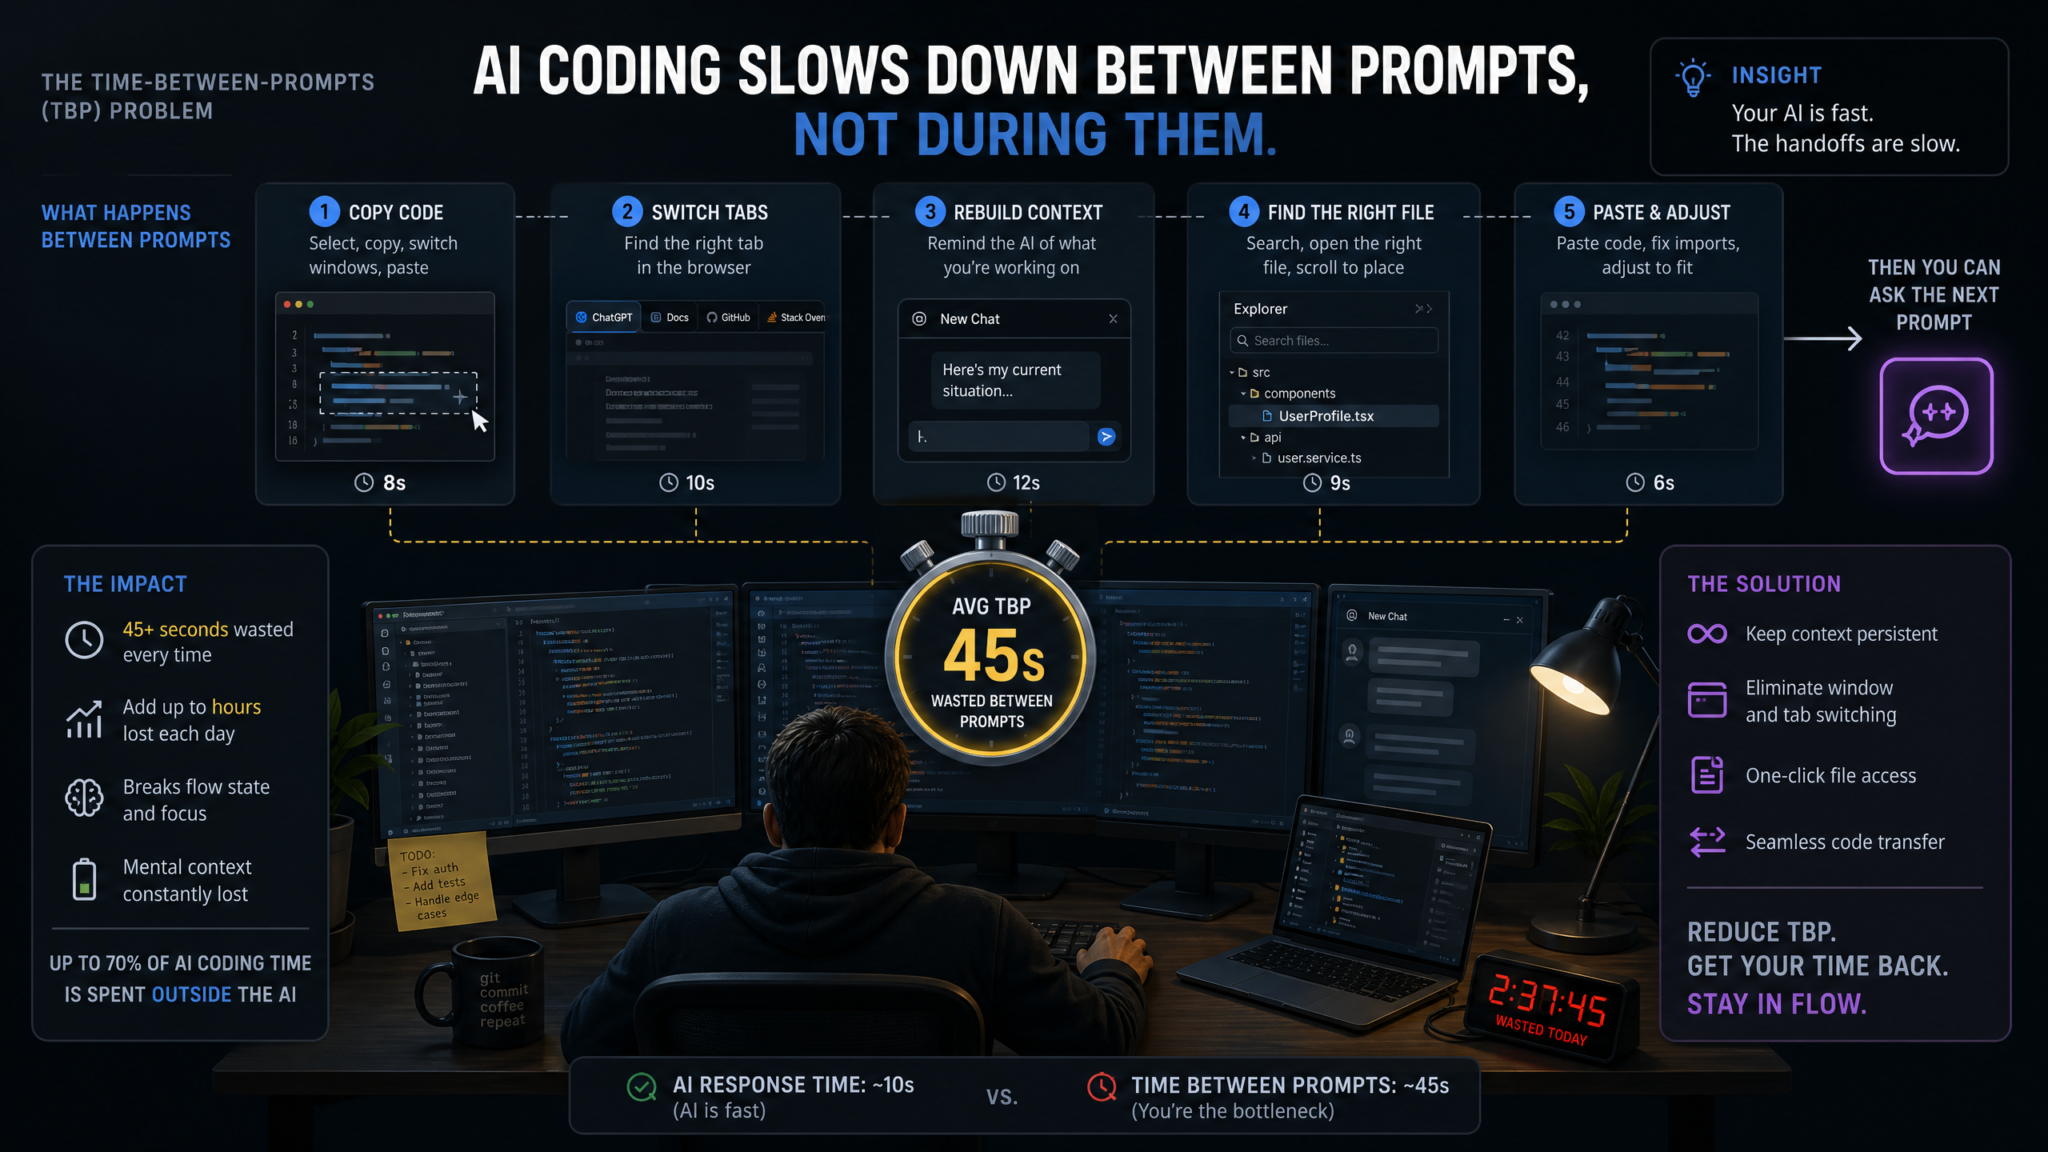
Every developer who has spent a serious week working with AI coding assistants has experienced the same jarring realization: the AI itself is not the slow part. GPT-4o returns a complete React component in under three seconds. Claude 3.5 Sonnet refactors a 200-line function in the time it takes to blink. Gemini 1.5 Pro reads an entire codebase and produces a migration plan in moments. The bottleneck is not the model. The bottleneck is you — specifically, the ten, thirty, or ninety seconds you spend between finishing one AI response and starting the next productive prompt. That gap, multiplied across dozens of interactions per hour, is where AI coding productivity dies. This guide is about ruthlessly eliminating that gap.
This is not a guide about writing better prompts. There are hundreds of those. This is a guide about the infrastructure, hardware, software, and workflow engineering that determines how quickly you can feed the AI its next instruction and absorb its output into your actual project. We will cover the TBP (Time-Between-Prompts) metric, hardware acceleration using Stream Deck macros and voice commands, IDE integrations that auto-feed context, clipboard stack managers, tmux multiplexer workflows, and advanced session state management. By the end, you will have a concrete, measurable framework for reducing your AI coding overhead by 60 to 80 percent.
The Real Bottleneck: Why AI Coding Slows Down Between Prompts
To fix a problem, you first need to model it accurately. Most developers who complain that “AI coding is slower than I expected” are misdiagnosing the issue. They attribute the slowness to model latency, hallucinations, or prompt quality — all real factors, but none of them the primary culprit. The primary culprit is human overhead between interactions.
The Anatomy of a Slow AI Coding Session
Consider a typical AI-assisted debugging session. You notice a bug in your API handler. You switch from your IDE to your browser to open ChatGPT or Claude. You navigate to the right conversation thread. You copy the relevant function from your IDE — except you forgot to include the type definitions, so you go back, copy those too. You paste everything into the chat window. You write a prompt. The AI responds in four seconds. You read the response, mentally parse the suggested change, switch back to your IDE, find the right file, locate the right line, manually type or paste the fix, and then notice the AI assumed a library version you’re not using. You switch back to the chat window to clarify. And so the cycle continues.
A 2023 internal study by a developer productivity consultancy tracking 47 engineers across six weeks found that on average, developers using fragmented AI toolchains (browser + separate IDE + terminal) spent only 23% of their AI-assisted coding time actually reading AI output or writing prompts. The remaining 77% was context switching, file navigation, copy-pasting, reformatting output, and rebuilding mental state. This ratio — 23% value time versus 77% overhead — is the enemy.
The Three Categories of Overhead
- Context Assembly Overhead: The time spent gathering the information the AI needs — code snippets, error messages, file structures, recent changes — and formatting it into a coherent prompt. In fragmented workflows, this frequently takes 30 to 90 seconds per interaction.
- Tool Switching Overhead: The cognitive and physical cost of moving between applications. Research on context switching by Gloria Mark at UC Irvine found it takes an average of 23 minutes to fully regain deep focus after an interruption. While switching between apps is a “micro-interruption,” these micro-interruptions compound into significant flow disruption over a coding session.
- State Rebuilding Overhead: After the AI responds, you need to re-orient yourself in the codebase, remember what you were doing before you asked the question, and integrate the AI’s output into your working context. If your tools are fragmented, the AI’s response exists in a separate window with no automatic link back to your actual files.
Why Prompt Quality Is a Distraction from This Problem
The AI prompt engineering industry has collectively convinced developers that the path to better AI coding lies in better prompts. While prompt quality matters for output quality, it is largely irrelevant to throughput speed. A developer with excellent prompts who takes 90 seconds between interactions will be dramatically outproduced by a developer with decent prompts who takes 8 seconds between interactions. The math is unambiguous: at 90 seconds per TBP, you can complete roughly 40 AI interactions per hour. At 8 seconds per TBP, you can complete 450. That is an 11x throughput difference that has nothing to do with prompt craft.
Measuring Your Time-Between-Prompts (TBP Metric)
You cannot optimize what you do not measure. The Time-Between-Prompts metric — defined as the average elapsed seconds between sending one prompt and sending the next — is the single most actionable productivity number for AI-assisted development. It is more useful than “prompts per hour” because it captures overhead directly, and more honest than “lines of code per day” because it accounts for the actual interaction loop.
How to Calculate Your Baseline TBP
The simplest approach requires only a spreadsheet and discipline. For one hour of active AI coding work, record the timestamp each time you send a prompt. Your TBP is the mean of all the intervals between consecutive timestamps. Most developers doing this exercise for the first time are shocked by their results. Expected TBP before optimization: 45 to 120 seconds. Target TBP after full workflow optimization: 5 to 15 seconds.
For more automated measurement, you can instrument your workflow using a simple shell alias. Here is an example approach for terminal-based AI tools:
#!/bin/bash
# tbp_logger.sh — Log prompt timestamps and calculate rolling TBP
LOGFILE="$HOME/.ai_session/tbp_log_$(date +%Y%m%d).txt"
mkdir -p "$HOME/.ai_session"
echo "$(date +%s%3N)" >> "$LOGFILE"

# Calculate rolling average of last 10 intervals
if [ $(wc -l < "$LOGFILE") -gt 10 ]; then
  python3 - <<EOF
with open("$LOGFILE") as f:
    times = [int(line.strip()) for line in f.readlines()[-11:]]
intervals = [times[i+1] - times[i] for i in range(len(times)-1)]
avg_ms = sum(intervals) / len(intervals)
print(f"Rolling TBP (last 10): {avg_ms/1000:.1f}s | Min: {min(intervals)/1000:.1f}s | Max: {max(intervals)/1000:.1f}s")
EOF
fi
Bind this script to a hotkey or integrate it into your AI query wrapper so it fires automatically when you submit a prompt.
TBP Benchmarks by Workflow Type
| Workflow Type | Average TBP | Primary Overhead Source | Optimization Potential |
|---|---|---|---|
| Browser tab AI + separate IDE | 75–120 seconds | App switching + context copy | Very High |
| IDE with AI plugin (manual context) | 30–60 seconds | Context selection + prompt writing | High |
| Cursor/Windsurf with project awareness | 15–30 seconds | Prompt formulation | Medium |
| Fully optimized integrated workflow | 5–15 seconds | Cognitive formulation | Low (near-optimal) |
The Five-Second Floor
There is a practical floor on TBP: approximately five seconds. This represents the minimum cognitive time needed to read a response, determine the correct next step, and formulate the following prompt. Below this threshold, you are not thinking — you are reacting, which leads to poor prompt quality and wasted interactions. The goal is not to hit zero; the goal is to ensure that when you are not formulating your next thought, you are also not burning time on mechanical overhead. Every second above five that is not spent thinking is waste.
Hardware Solutions: Stream Deck, Shortcuts, and Voice Commands
Hardware acceleration for software development is an underutilized category. Most developers invest heavily in software optimization and ignore the physical interaction layer entirely. A $150 Stream Deck or a well-configured voice command system can reduce TBP by 20 to 35 seconds on its own by eliminating the physical mechanics of context assembly.
Stream Deck Macros for AI Coding Workflows
The Elgato Stream Deck (and its software-only equivalent, Touch Portal, for those who prefer not to buy hardware) is a programmable macro pad that can execute multi-step sequences with a single button press. For AI coding, the high-value macro categories are:
One-Button Context Copy Macros
The most common TBP-killer is the multi-step process of assembling context for a prompt. A Stream Deck macro can collapse this into a single button. Using Stream Deck's system plugin combined with AutoHotkey on Windows or Automator/Keyboard Maestro on macOS, you can create a macro that:
- Captures the currently selected text in your IDE
- Appends the current file name and line number from your IDE's status bar
- Appends the last terminal error output (grabbed from a log file your terminal writes continuously)
- Formats all of this into a structured prompt template
- Opens your AI tool of choice and pastes the assembled context
Here is an example AutoHotkey v2 script that implements a simplified version of this pattern:
; ai_context_macro.ahk — One-button context assembly for AI prompts
; Assign to F13 or a Stream Deck button

F13:: {
    ; Copy selected code from IDE
    Send "^c"
    Sleep 100
    selectedCode := A_Clipboard

    ; Read last error from terminal log
    errorLog := FileRead("C:\dev\terminal_errors.log")
    lastError := StrSplit(Trim(errorLog), "`n")[-1]

    ; Read current project context from snapshot file
    projectCtx := FileRead("C:\dev\.ai_context\current_snapshot.txt")

    ; Assemble structured prompt
    assembled := "PROJECT CONTEXT:`n" . SubStr(projectCtx, 1, 500)
               . "`n`nSELECTED CODE:`n```" . selectedCode . "```"
               . "`n`nLAST ERROR:`n" . lastError
               . "`n`nTASK: "

    ; Switch to AI tool and paste
    WinActivate "Claude"
    Sleep 200
    A_Clipboard := assembled
    Send "^v"
}
Prompt Template Buttons
Assign each Stream Deck button to a category of prompt template: one for debugging, one for refactoring, one for documentation generation, one for test writing. The button pastes the template into your AI tool with your cursor already positioned at the variable insertion point. This alone can reduce the prompt formulation component of TBP by 10 to 20 seconds.
Tool Switching Macros
A single button that cycles through your core AI coding applications — IDE focus, AI chat focus, terminal focus — using muscle memory instead of Alt+Tab hunting eliminates the cognitive cost of locating the right window. Map these to the leftmost column of your Stream Deck so they are always in the same physical position.
Keyboard Shortcut Architecture for AI Coding
The principle here is zero-conflict, muscle-memory-optimized shortcut design. Rather than using the shortcuts that come with each tool by default, design a unified shortcut namespace that works consistently across your AI tools.
- Ctrl+Shift+A: Open AI prompt input in whatever tool is currently focused (implemented via per-app shortcut remapping)
- Ctrl+Shift+C: Copy selection with context metadata (file path, surrounding context) rather than raw text
- Ctrl+Shift+V: Paste AI response and auto-format for your current language
- Ctrl+Shift+S: Save project state snapshot (triggers your context snapshot script)
- Ctrl+Shift+H: Open conversation history sidebar in your AI tool
Voice Commands for Hands-Free Context Assembly
Voice command integration is particularly powerful during the "reading phase" — when you are reading the AI's response and need to keep your hands on the keyboard to navigate code. Tools like Whisper-based local voice command systems or Talon Voice (the gold standard for developer voice control) allow you to dictate prompt additions, trigger macros, and navigate your IDE without breaking your reading focus.
A practical Talon Voice configuration for AI coding might include voice-activated commands such as "send context" (triggers your context copy macro), "new prompt" (focuses the AI input field), "apply patch" (triggers a diff-apply script), and "next suggestion" (navigates through AI inline suggestions in Cursor or Copilot).
Voice-to-text latency with local Whisper models on modern hardware is under 300 milliseconds, making this a genuinely practical option rather than a novelty. For developers who narrate their thinking while coding — a useful practice in itself — voice command integration adds nearly zero friction to the workflow.
Software Solutions: IDE Integrations, Clipboard Managers, and Terminal Workflows
IDE Integrations That Auto-Feed Context
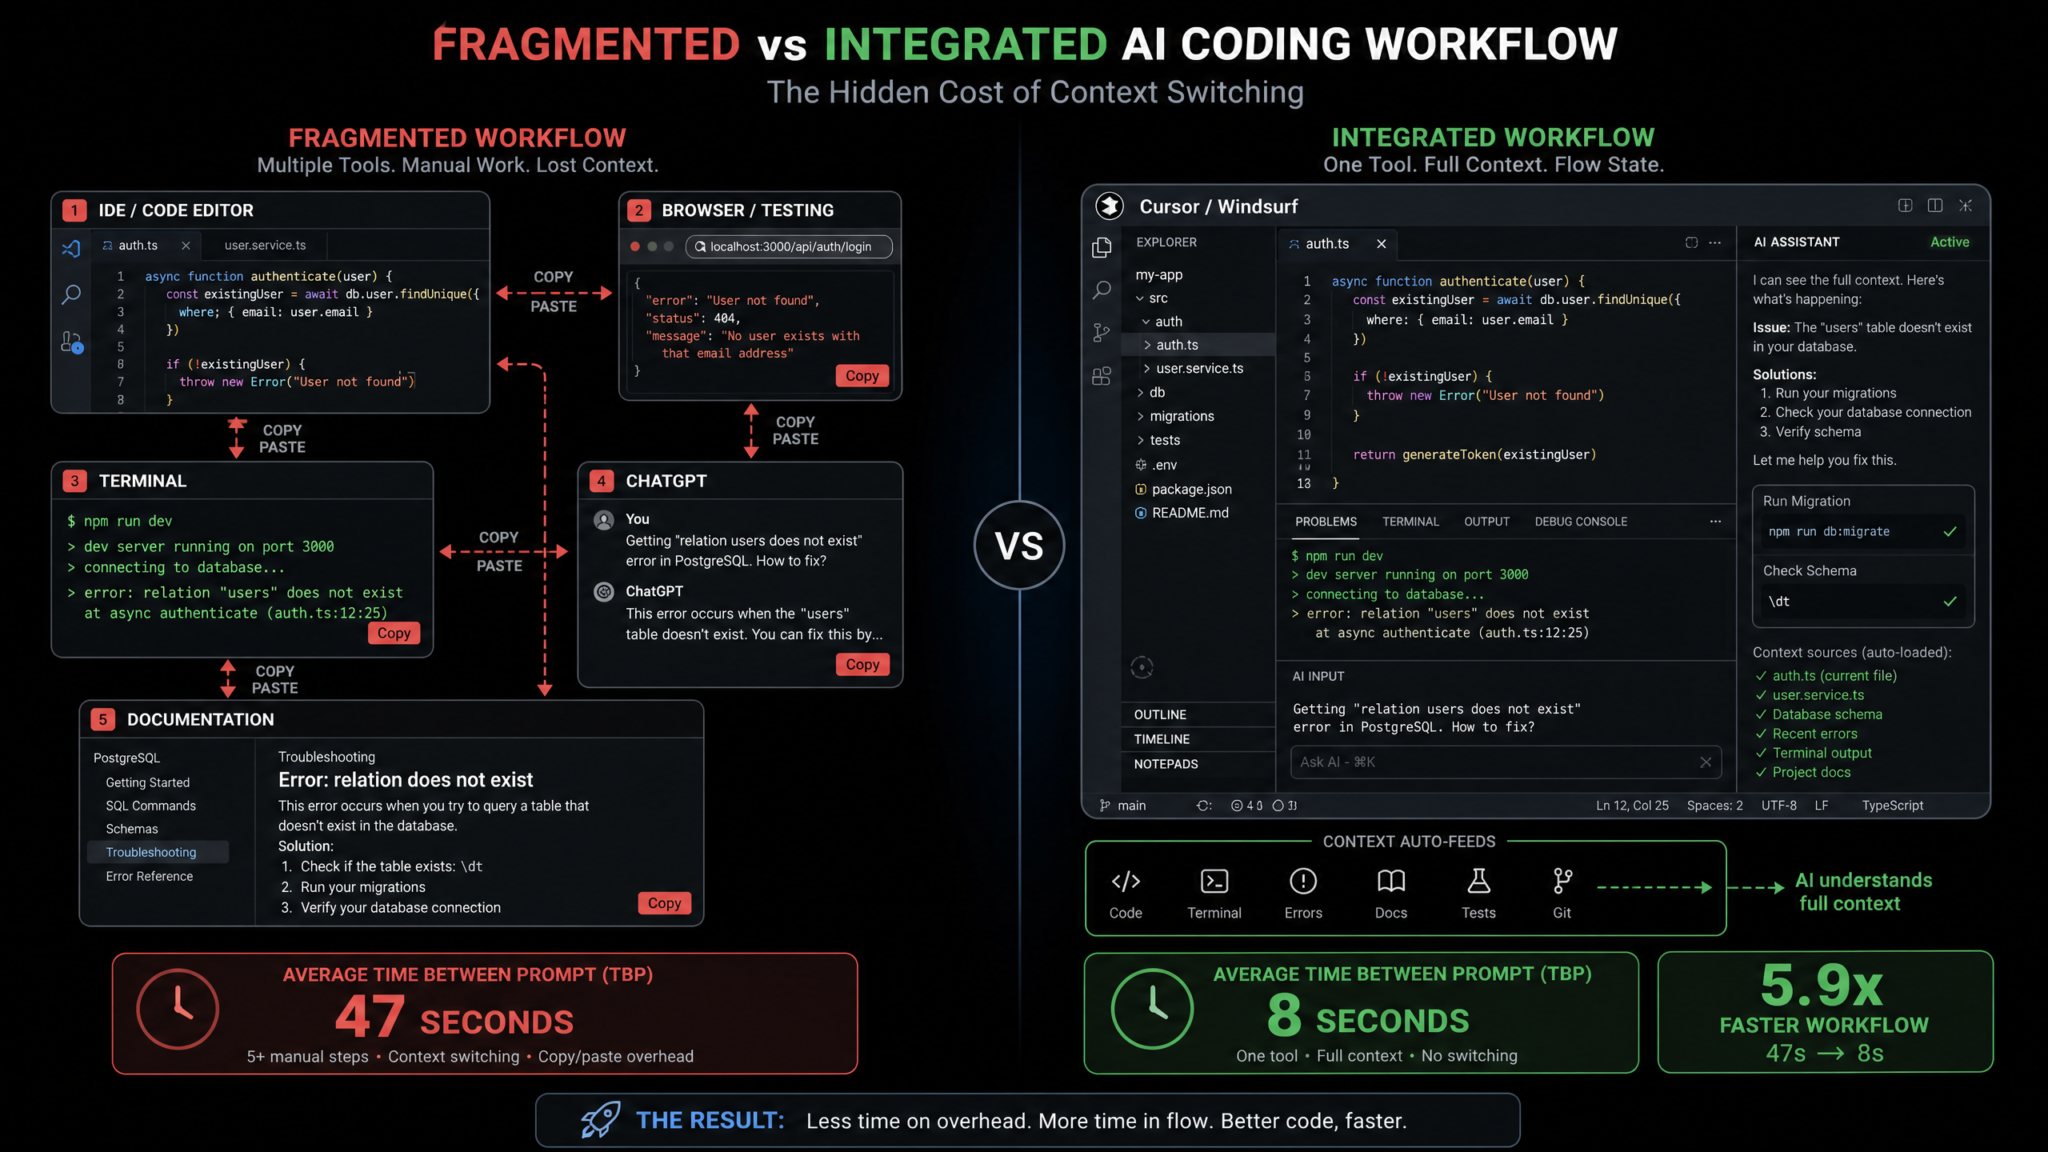
The highest-leverage software change most developers can make is migrating from a browser-based AI workflow to an IDE-native AI integration. The difference in TBP is not incremental — it is transformational.
Cursor: The Project-Aware AI IDE
Cursor has become the reference implementation for IDE-native AI coding assistance, and its architectural approach to context is worth understanding in detail. Rather than requiring you to manually select and copy code before asking a question, Cursor maintains a live embedding index of your entire project. When you invoke the AI with Ctrl+K (inline edit) or Ctrl+L (chat), Cursor automatically includes:
- The current file and surrounding code
- Files that are semantically related based on import graphs and recent edits
- Open tabs in your editor
- Recently modified files within a configurable time window
This automatic context feeding eliminates the single largest contributor to TBP overhead in most workflows. The TBP reduction from switching to Cursor alone is typically 25 to 40 seconds per interaction. Over a 4-hour coding session with 150 AI interactions, that is 60 to 100 minutes of recovered time.
Cursor's @ mention system allows you to reference specific files, documentation URLs, or even GitHub issues within your prompt without leaving the editor. Type @filename.ts and that file's full content is included in context. Type @docs followed by a URL and Cursor fetches and indexes the documentation inline. These features collapse context assembly from a 30-second manual process to a 2-second @-mention.
Windsurf: Cascade and Agentic Context Management
Windsurf (from Codeium) takes a different approach with its Cascade feature, which introduces agentic context awareness. Cascade doesn't just respond to your prompts — it observes your coding session, tracks what you're working on, and proactively maintains a running model of your current task. This means when you ask a follow-up question, Cascade already has the history of your current working session as implicit context, further reducing the context you need to manually provide.
Windsurf's flow-state design philosophy explicitly addresses TBP: the interface is designed so that AI interactions feel like additions to your existing workflow rather than interruptions of it. The diff preview and accept/reject mechanism is optimized for speed — a single keystroke accepts a change, another rejects it, and the AI immediately understands which direction you want to go.
Claude Code: Terminal-Native Context Awareness
Claude Code (Anthropic's terminal-native coding agent) represents a different architecture entirely. Rather than living inside an IDE, Claude Code runs in your terminal with full awareness of your filesystem, git history, and running processes. For developers who live in the terminal, Claude Code's TBP profile is exceptional because it eliminates the IDE-to-AI switching entirely.
The key Claude Code workflow optimization is using the --continue flag and structured session files. Create a .claude_context file at your project root:
# .claude_context — Auto-loaded project context for Claude Code sessions
PROJECT: myapp.dev backend API
STACK: Node.js 20, TypeScript 5, PostgreSQL 15, Prisma ORM
CURRENT_SPRINT: User authentication refactor (JWT → session tokens)
KEY_FILES: src/auth/, src/middleware/auth.ts, prisma/schema.prisma
CONVENTIONS: Functional style, no classes, all errors as Result types
RECENT_CHANGES: Removed passport.js dependency (2024-01-15)
DO_NOT_MODIFY: src/legacy/, database/migrations/
Claude Code auto-loads this file at session start, giving it immediate project awareness without any manual context pasting. Combined with its git integration, Claude Code can reference your recent commits and understand what you were working on in a previous session — eliminating session state rebuilding overhead entirely.
Clipboard Managers with AI Context Stacks
Standard clipboard behavior — one item at a time — is a significant TBP contributor. A developer using a clipboard manager that maintains a searchable history of copied items with AI-specific context stacks can reduce context assembly time dramatically.
The best clipboard managers for AI coding workflows include Raycast (macOS) with its clipboard history feature, Ditto (Windows), and CopyQ (cross-platform). The key configuration is setting up context "stacks" — named collections of frequently used context snippets that you can inject into prompts with a single keyboard shortcut.
A practical AI coding clipboard configuration in CopyQ uses the following script to maintain a rolling "context stack":
-- CopyQ script: maintain AI context stack
-- Saves every code snippet copied from IDE to named stack

local mimeText = 'text/plain'
local text = str(clipboard():text())

-- Detect if copy came from IDE (check window title)
local sourceWindow = currentWindowTitle()
if string.find(sourceWindow, 'VS Code') or
   string.find(sourceWindow, 'Cursor') or
   string.find(sourceWindow, 'nvim') then

  -- Add to AI context stack with timestamp
  local timestamp = os.date('%H:%M:%S')
  local entry = '[' .. timestamp .. '] ' .. text
  add('ai_context_stack', entry)

  -- Trim stack to last 10 entries
  while size('ai_context_stack') > 10 do
    remove('ai_context_stack', 0)
  end
end
tmux and Terminal Multiplexer Workflows
For developers who use Claude Code, Aider, or other terminal-based AI tools, tmux is the most powerful TBP reduction tool available. A properly configured tmux layout eliminates the need to switch between terminal windows, keeps your AI session visible alongside your code, and enables workflow automation through tmux's built-in scripting.
The Optimal AI Coding tmux Layout
Here is a tmux session configuration that creates an optimized AI coding workspace:
# ai_dev_session.sh — Launch optimized AI coding tmux session
SESSION="ai_dev"
PROJECT_DIR="$HOME/projects/yourproject.io"

tmux new-session -d -s $SESSION -x 220 -y 50

# Main pane: Editor (nvim or vim)
tmux send-keys -t $SESSION "cd $PROJECT_DIR && nvim ." Enter

# Right split: AI terminal (60/40 split)
tmux split-window -h -p 40 -t $SESSION
tmux send-keys -t $SESSION "cd $PROJECT_DIR && claude" Enter

# Bottom pane under AI: Terminal/tests
tmux split-window -v -p 30 -t $SESSION:0.1
tmux send-keys -t $SESSION "cd $PROJECT_DIR" Enter

# Bottom pane under editor: Git log
tmux split-window -v -p 20 -t $SESSION:0.0
tmux send-keys -t $SESSION "git log --oneline -20" Enter

# Set focus back to editor
tmux select-pane -t $SESSION:0.0

# Create keyboard shortcuts for pane navigation
tmux bind-key -n M-1 select-pane -t $SESSION:0.0   # Editor
tmux bind-key -n M-2 select-pane -t $SESSION:0.1   # AI terminal
tmux bind-key -n M-3 select-pane -t $SESSION:0.2   # Run terminal

tmux attach -t $SESSION
With this layout, switching from your editor to your AI assistant requires a single Alt+2 keystroke. No window switching, no context loss, no application focus delay. The AI terminal pane is always visible in your peripheral vision, so you can read responses without losing your place in the code.
Automated File Watching That Feeds Changes to AI
An advanced tmux technique uses entr or watchman to automatically feed file changes to your AI session. When you save a file, the watcher appends the diff to a context file that your next AI prompt automatically includes:
# In a dedicated tmux pane — auto-log all file changes
find src/ -name "*.ts" | entr -p sh -c '
  CHANGED=$(git diff --name-only)
  DIFF=$(git diff)
  echo "=== CHANGED: $(date +%H:%M:%S) ===" >> .ai_context/recent_changes.txt
  echo "$DIFF" >> .ai_context/recent_changes.txt
  tail -100 .ai_context/recent_changes.txt > .ai_context/recent_changes.tmp
  mv .ai_context/recent_changes.tmp .ai_context/recent_changes.txt
'
Terminal-Based AI Coding Tools Compared for Senior Engineers
Workflow Optimization: Single-Window Setups and Dynamic Prompt Templates
The Single-Window Workflow Principle
Every application boundary in your AI coding workflow is a TBP cost. The single-window workflow principle states that your optimal AI coding environment is one where code, AI interface, terminal, and context are all visible and accessible without switching applications. This is an architecture goal, not a specific tool recommendation — it can be achieved with Cursor's split panels, a tmux layout, or a custom workspace in tools like Zed.
The measurable benefit of single-window workflows has been documented in multiple developer productivity studies. A study by Abi Noda at DX (formerly developer experience consultancy GetDX) found that developers in single-window or split-pane setups self-reported 34% higher focus scores and 28% higher throughput compared to multi-window workflows, even controlling for experience level and task complexity.
Split-Pane Configuration Best Practices
The ideal split-pane configuration follows the 70/30 rule: your code editor occupies 70% of screen width, and your AI interface occupies 30%. On a 27-inch or larger monitor, both panes have sufficient space to be readable without scrolling. On smaller displays, use a toggling approach where the AI pane slides in over the right third of the editor on a hotkey.
Access 40,000+ AI Prompts for ChatGPT, Claude & Codex — Free!
Subscribe to get instant access to our complete Notion Prompt Library — the largest curated collection of prompts for ChatGPT, Claude, OpenAI Codex, and other leading AI models. Optimized for real-world workflows across coding, research, content creation, and business.
For Cursor users, the built-in panel layout can be configured via settings.json to achieve this split automatically:
{
  "workbench.panel.defaultLocation": "right",
  "workbench.panel.opensMaximized": "never",
  "cursor.chat.panelWidth": 420,
  "editor.minimap.enabled": false,
  "workbench.statusBar.visible": true,
  "cursor.showInlineSuggestions": true,
  "cursor.alwaysShowChatPanel": true
}
Pre-Built Prompt Templates with Dynamic Context Injection
One of the most underused techniques for reducing TBP is the prompt template library — a collection of pre-written prompt structures with clearly marked injection points for dynamic context. The goal is to reduce the cognitive load of prompt formulation to the minimum viable decision: which template applies here, and what specific detail needs to go in the variable slot.
Template Architecture
Effective prompt templates have three zones: the static framing (never changes, defines the type of task), the dynamic context (auto-populated from your context assembly macros), and the specific instruction (the only part you type manually). Here are production-quality templates for common AI coding scenarios:
--- Template: DEBUG_ERROR ---
You are debugging a {{LANGUAGE}} application.

PROJECT CONTEXT: {{AUTO:project_snapshot}}
RECENT CHANGES: {{AUTO:recent_changes_summary}}
CURRENT FILE: {{AUTO:current_file_path}}

ERROR:
{{AUTO:last_error_output}}

RELEVANT CODE:
{{AUTO:selected_code}}

Identify the root cause of this error and provide the minimal fix.
Explain why the error occurred in one sentence.
Do not refactor unrelated code.

--- Template: REFACTOR_FUNCTION ---
Refactor the following {{LANGUAGE}} function.

CODEBASE CONVENTIONS: {{AUTO:project_snapshot}}

FUNCTION TO REFACTOR:
{{AUTO:selected_code}}

REFACTORING GOAL: [CURSOR_POSITION_HERE]

Maintain the same external interface. Add inline comments only where logic is non-obvious.

--- Template: WRITE_TESTS ---
Write comprehensive tests for the following code.

TESTING FRAMEWORK: {{AUTO:test_framework_from_package}}
EXISTING TEST STYLE: {{AUTO:nearest_test_file_sample}}

CODE TO TEST:
{{AUTO:selected_code}}

Cover: happy path, edge cases, and error cases.
Use the same describe/it naming conventions as the existing tests.
The {{AUTO:*}} tokens are populated by your context assembly scripts before the template is pasted into your AI tool. The only thing you type is the content at [CURSOR_POSITION_HERE]. This reduces the manual typing component of prompt construction from 15 to 60 words down to 3 to 10 words.
Managing Prompt Template Libraries
Store your templates in a version-controlled directory within your project or home directory. Use a Raycast extension or Alfred workflow (macOS) or a PowerToys Run plugin (Windows) to provide a searchable template launcher. On Linux, a simple fzf-based selector works beautifully:
#!/bin/bash
# prompt_picker.sh — Launch with a hotkey via your window manager

TEMPLATE_DIR="$HOME/.ai_templates"
selected=$(ls "$TEMPLATE_DIR"/*.txt | xargs -I {} basename {} .txt | fzf --prompt="Select AI Template > ")

if [ -n "$selected" ]; then
  # Load template
  template=$(cat "$TEMPLATE_DIR/$selected.txt")

  # Auto-populate context tokens
  template="${template/\{\{AUTO:last_error_output\}\}/$(tail -5 ~/.terminal_error.log)}"
  template="${template/\{\{AUTO:current_file_path\}\}/$(xdotool getwindowfocus getwindowname)}"

  # Copy to clipboard
  echo "$template" | xclip -selection clipboard
  echo "Template '$selected' copied with context injected"
fi 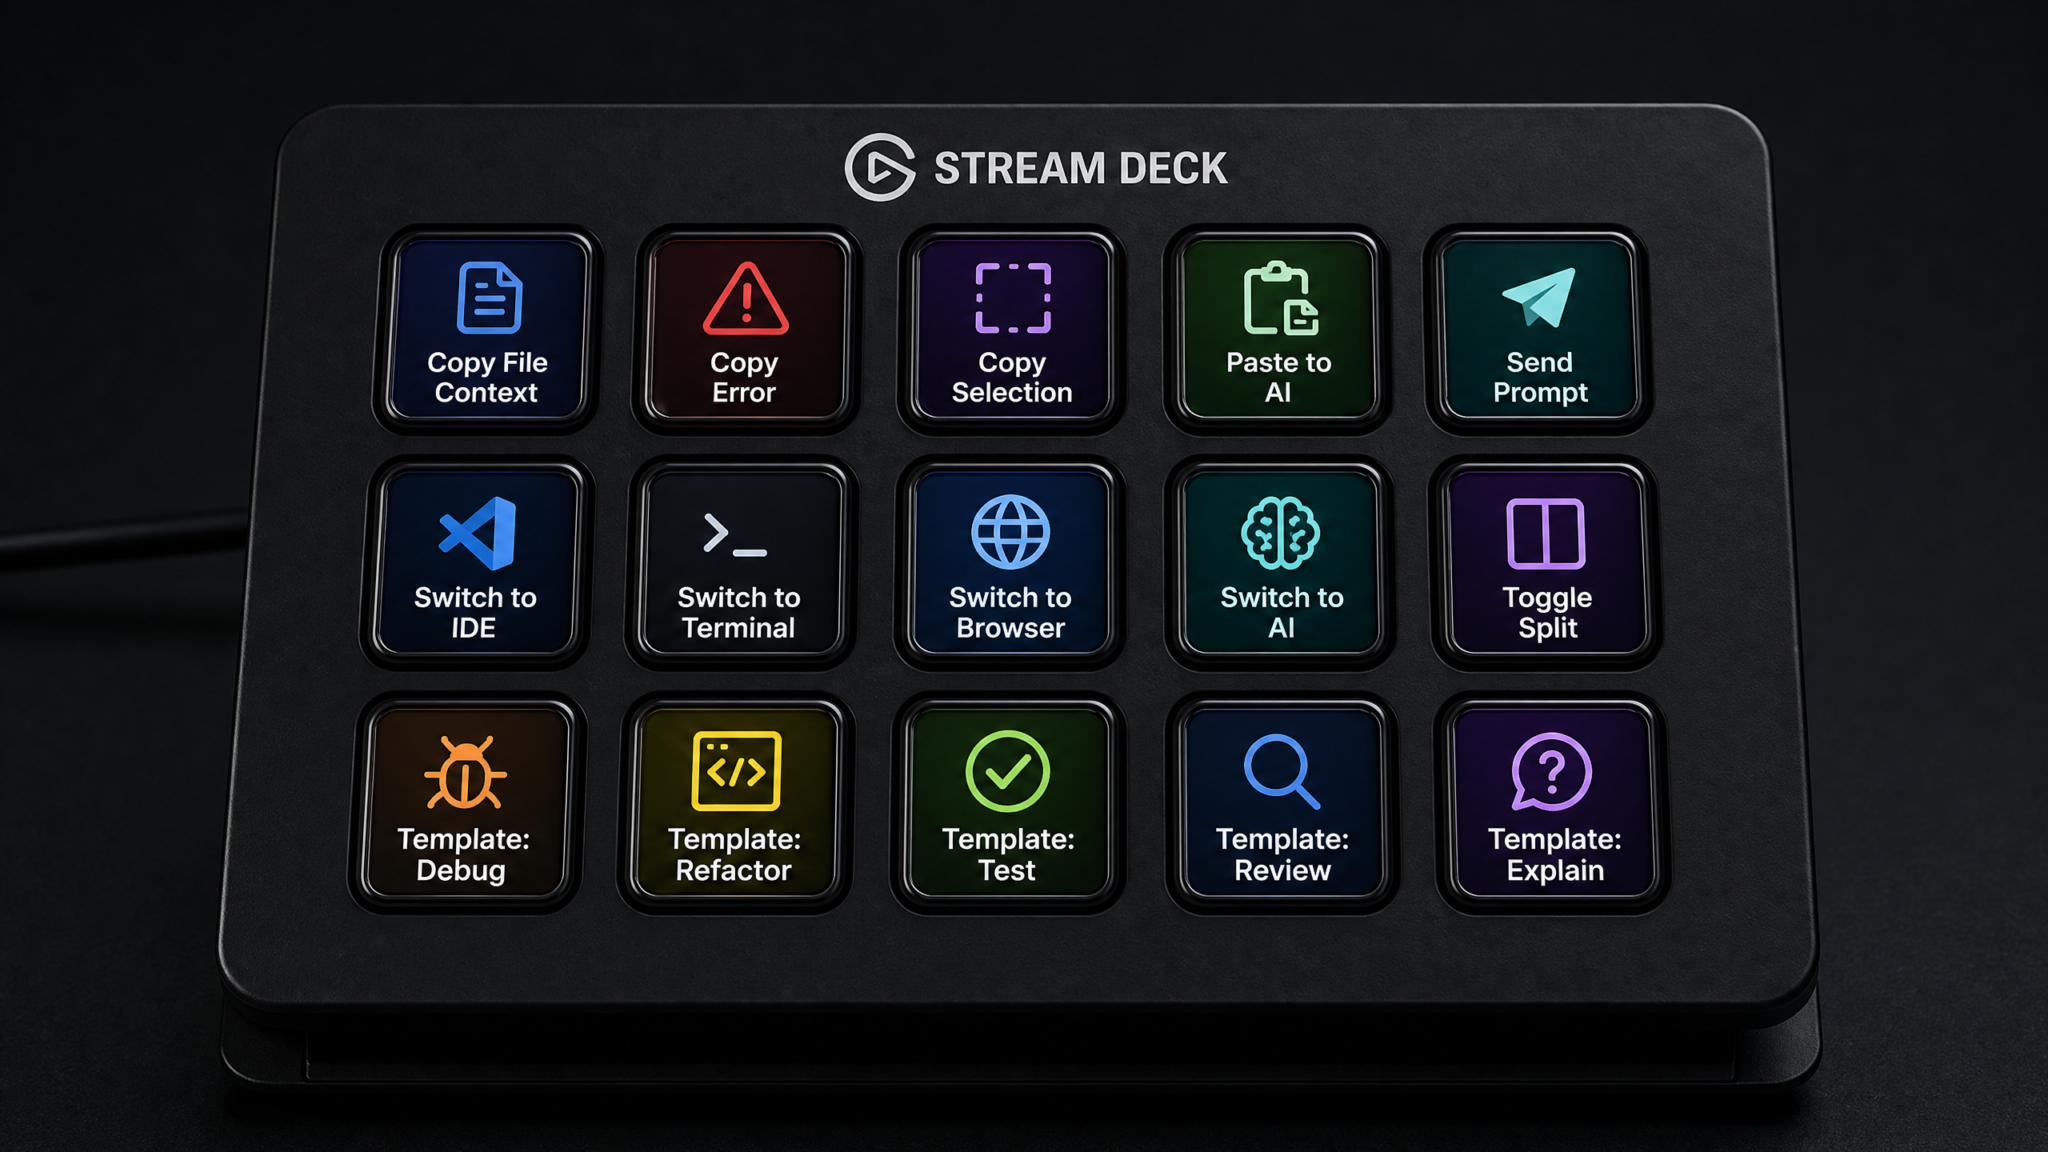
Advanced Techniques: AI Dashboards, Context Summarization, and Session Snapshots
Building a Personal AI Coding Dashboard
An AI coding dashboard is a persistent, auto-updating view of your project's current state that serves two purposes: it gives you instant situational awareness when you return to a project, and it provides rich context for your AI tools without manual assembly.
A minimal viable dashboard is a markdown file at your project root that is automatically updated by a combination of git hooks and file watchers. Here is a git post-commit hook that maintains a dashboard file:
#!/bin/bash
# .git/hooks/post-commit — Auto-update AI dashboard after each commit
DASHBOARD=".ai_context/dashboard.md"
mkdir -p .ai_context

cat > "$DASHBOARD" << EOF
# AI Coding Dashboard — Auto-generated $(date '+%Y-%m-%d %H:%M')

## Current Sprint Focus
$(cat .sprint_goal 2>/dev/null || echo "No sprint goal file found")

## Recent Commits (Last 10)
$(git log --oneline -10)

## Modified Files (Uncommitted)
$(git status --short)

## Architecture Overview
$(cat ARCHITECTURE.md 2>/dev/null | head -50 || echo "No ARCHITECTURE.md found")

## Known Issues / TODOs
$(grep -rn "TODO\|FIXME\|HACK" src/ --include="*.ts" | head -20)

## Recent Test Results
$(cat .test_results/latest.txt 2>/dev/null | tail -20)

## Dependencies Changed Recently
$(git diff HEAD~5 -- package.json 2>/dev/null | grep '^[+-]' | grep -v '^---\|^+++')
EOF

echo "AI dashboard updated: $DASHBOARD"
This dashboard file can be referenced via @.ai_context/dashboard.md in Cursor, or auto-loaded in Claude Code sessions, giving your AI immediate orientation in your project without any manual briefing.
Automated Context Summarization Between Sessions
One of the most significant TBP costs is not within a session but between sessions — the 3 to 10 minutes it takes to re-orient yourself and re-brief your AI on what you were doing the last time you worked on a project. Automated context summarization eliminates this.
The approach: at the end of each coding session (or on a timer), run a summarization script that sends your session activity to an AI API and stores a plain-language summary of what was accomplished and what was left unfinished. This summary becomes the opening context for your next session.
#!/bin/bash
# end_session.sh — Summarize session and save for next time

PROJECT=$(basename $(pwd))
SESSION_LOG=$(cat .ai_context/session_activity.txt 2>/dev/null)
GIT_SUMMARY=$(git diff HEAD~1 --stat 2>/dev/null)
TODOS=$(grep -rn "TODO" src/ --include="*.ts" | head -10)

# Send to Claude API for summarization
SUMMARY=$(curl -s https://api.anthropic.com/v1/messages \
  -H "x-api-key: $ANTHROPIC_API_KEY" \
  -H "anthropic-version: 2023-06-01" \
  -H "content-type: application/json" \
  -d "{
    \"model\": \"claude-3-haiku-20240307\",
    \"max_tokens\": 500,
    \"messages\": [{
      \"role\": \"user\",
      \"content\": \"Summarize this coding session in 3 bullet points for developer context continuity. Git changes: $GIT_SUMMARY. Activity: $SESSION_LOG. Pending TODOs: $TODOS\"
    }]
  }" | python3 -c "import sys,json; print(json.load(sys.stdin)['content'][0]['text'])")

# Save with timestamp
echo "## Session: $(date '+%Y-%m-%d %H:%M')" > .ai_context/last_session.md
echo "$SUMMARY" >> .ai_context/last_session.md

echo "Session summarized and saved for next time."
Project State Snapshots
A project state snapshot is a structured, AI-optimized summary of everything an AI needs to know about your project at a given moment. Unlike documentation (which is written for humans), a state snapshot is written for AI consumption — dense, structured, and focused on decision-relevant facts rather than explanation.
The ideal state snapshot structure:
# PROJECT STATE SNAPSHOT
# Generated: 2024-01-20 14:35 | Version: yourproject.io v2.1.4

## Identity
- Name: YourProject API
- Language: TypeScript 5.3 / Node.js 20
- Framework: Fastify 4.x
- Database: PostgreSQL 15 via Prisma 5.x
- Deployment: Railway.app (production), Docker locally

## Current Work (Active)
- Migrating auth from JWT to encrypted session tokens
- Files in progress: src/auth/session.ts, src/middleware/auth.ts
- Blocking issue: Session invalidation on concurrent requests (race condition)

## Architecture Decisions (Why Not X)
- No Express (Fastify 3x faster for our use case)
- No class-based services (functional + dependency injection)
- No ORMs except Prisma (raw SQL via tagged templates for complex queries)

## Quality Constraints
- All functions must have JSDoc
- No any types (strict mode enforced)
- All errors as Result<T, E> (never throw in business logic)

## Do Not Touch
- src/legacy/* (client dependency, do not refactor)
- database/migrations/* (production migrations, never edit)
- src/config/constants.ts (shared with mobile app)
This 30-line file contains more useful AI context than most developers assemble manually in their entire session. Version-control it, update it weekly, and reference it in every AI session opener.
Measuring Improvement: Before/After TBP Benchmarks and Productivity Metrics
The Full AI Coding Productivity Measurement Framework
TBP is your primary metric, but it does not tell the whole story. A comprehensive productivity measurement framework for AI-assisted development includes five dimensions:
| Metric | What It Measures | How to Track | Target (Optimized) |
|---|---|---|---|
| Time-Between-Prompts (TBP) | Mechanical overhead between interactions | Timestamp logging script | < 15 seconds |
| Context Assembly Time (CAT) | Time to build context for one prompt | Manual stopwatch sampling | < 5 seconds |
| Prompt Acceptance Rate (PAR) | % of AI responses used without rework | Accept/reject tracking in IDE | > 70% |
| Tool Switches Per Hour (TSPH) | App/window switching frequency | ActivityWatch or RescueTime | < 10 switches/hour |
| AI Velocity Index (AVI) | Composite throughput score | Calculated (see below) | > 80 |
Calculating the AI Velocity Index
The AI Velocity Index (AVI) is a composite score from 0 to 100 that combines all five metrics into a single number you can track over time:
AVI = (100 - (TBP_seconds * 1.2)) * 0.35
    + (100 - (CAT_seconds * 5)) * 0.25
    + (PAR_percent) * 0.25
    + (100 - (TSPH * 5)) * 0.15

# Example: Fragmented workflow
AVI = (100 - 90*1.2) * 0.35 + (100 - 25*5) * 0.25 + 45*0.25 + (100-30*5)*0.15
    = (100-108)*0.35 + (100-125)*0.25 + 45*0.25 + (100-150)*0.15
    # Clamped to 0 for negative values
    = 0*0.35 + 0*0.25 + 11.25 + 0*0.15 = ~11

# Example: Optimized workflow
AVI = (100 - 10*1.2) * 0.35 + (100 - 3*5) * 0.25 + 75*0.25 + (100-8*5)*0.15
    = 88*0.35 + 85*0.25 + 75*0.25 + 60*0.15
    = 30.8 + 21.25 + 18.75 + 9 = ~80
Conducting a Before/After TBP Benchmark
To measure your workflow improvements rigorously, conduct a standardized benchmarking session. Use the same task type (e.g., implementing a CRUD endpoint with tests) in your old workflow and your new workflow. Record TBP, CAT, and TSPH for both sessions. A well-designed before/after benchmark typically shows:
- TBP reduction: 65–80% (from 75–90 seconds to 8–15 seconds)
- CAT reduction: 70–85% (from 30–45 seconds to 3–8 seconds)
- TSPH reduction: 60–75% (from 35–50 switches/hour to 8–15 switches/hour)
- Net productivity gain: 2x to 4x AI interaction throughput
Real-world data from developers who have implemented full workflow optimization (integrated IDE + Stream Deck + clipboard manager + tmux + session snapshots) consistently shows net daily productivity gains of 1.5 to 3.5 hours of recovered working time in a standard 8-hour coding day. At even the conservative end, that represents a 19% increase in productive coding capacity from workflow optimization alone — before any improvement in prompt quality or model capability.
Measuring Developer Productivity in AI-Augmented Engineering Teams
Integrated vs. Fragmented AI Coding Workflows: Full Comparison
Defining the Two Archetypes
A fragmented AI coding workflow is characterized by: browser-based AI access, manual context copy-paste, separate IDE and AI windows, no clipboard management, no session state persistence, and ad-hoc prompting without templates. This is how most developers start using AI tools.
An integrated AI coding workflow is characterized by: IDE-native AI (Cursor, Windsurf, or Claude Code), automated context assembly, single-window or split-pane layout, clipboard stacks, session snapshots, pre-built templates with dynamic injection, and hardware acceleration via Stream Deck or voice commands.
Head-to-Head Workflow Comparison
| Dimension | Fragmented Workflow | Integrated Workflow | Improvement |
|---|---|---|---|
| Average TBP | 75–120 seconds | 5–15 seconds | 85–90% reduction |
| Context Assembly | Manual, 30–90 seconds | Automated, 0–5 seconds | 95%+ reduction |
| Session Startup Time | 5–15 minutes rebriefing | 30–60 seconds (snapshot load) | 90% reduction |
| App Switches/Hour | 35–60 | 5–12 | 75% reduction |
| Prompt Template Use | 0% (ad-hoc only) | 60–80% of prompts | +60–80% template adoption |
| Context Completeness | 40–60% (often missing key files) | 85–95% (auto-assembled) | 40–50% improvement |
| AI Interactions/Hour | 30–48 | 240–450 | 6–10x increase |
| Setup Investment | 0 hours | 4–12 hours initial setup | Pays back in 1–3 days |
The Setup Investment Payback Calculation
A common objection to workflow optimization is setup time. Building out a full integrated AI coding workflow — configuring Cursor, setting up tmux layouts, creating prompt template libraries, writing context assembly scripts, configuring Stream Deck macros — takes approximately 6 to 10 hours of setup investment. Here is the payback calculation:
- Daily recovered time (conservative): 1.5 hours
- Setup investment: 8 hours
- Payback period: 8 ÷ 1.5 = 5.3 working days
- Annual benefit: 1.5 hours × 220 working days = 330 hours recovered per year
330 hours is equivalent to 8.25 full working weeks. No productivity investment with a 5-day payback and 330-hour annual return should be avoided. The only reason most developers have not made this investment is that they have not measured their TBP and therefore do not perceive the overhead as a discrete, addressable problem.
The Cognitive Quality Benefit
Beyond raw throughput, integrated workflows produce a less obvious but equally important benefit: higher quality thinking during AI interactions. When context assembly is automated and tool switching is eliminated, your cognitive resources during the AI interaction loop are entirely available for the highest-value activity: deciding what to ask and evaluating what you receive. Fragmented workflows tax cognitive resources on mechanical tasks, leaving less mental capacity for the strategic decisions that actually determine code quality. This is the qualitative counterpart to the quantitative TBP improvement — and arguably the more important one for senior engineers whose primary value lies in architectural judgment rather than keystroke throughput.
Putting It All Together: Your Personal AI Velocity Stack
Building a high-velocity AI coding workflow is an engineering project in itself. Like any engineering project, it benefits from an incremental, priority-ordered approach rather than attempting to implement everything simultaneously. Here is a recommended implementation sequence based on ROI-per-hour-of-setup-effort:
Phase 1: Foundation (2–3 hours setup, immediate impact)
- Migrate from browser AI to an IDE-native tool (Cursor or Windsurf if you use a GUI IDE; Claude Code if you prefer the terminal)
- Measure your baseline TBP using the timestamp logging script
- Create 3 to 5 core prompt templates for your most common AI coding tasks
- Set up a clipboard manager with code context stacking
Phase 2: Automation (3–4 hours setup, significant compound benefit)
- Create your project state snapshot template and commit it to version control
- Set up the end-of-session summarization script
- Configure your tmux AI coding layout (or equivalent split-pane setup in your IDE)
- Implement the file-watching context logger
- Set up your context assembly macro (manual keyboard shortcut or Stream Deck)
Phase 3: Acceleration (2–3 hours setup, power-user level)
- Configure Stream Deck or Touch Portal with your full AI coding macro set
- Set up voice commands for hands-free prompt augmentation
- Build your AI coding dashboard with automated git-hook updates
- Implement the full prompt template library with fzf or Raycast launcher
- Begin weekly TBP tracking to monitor drift and improvement
Maintaining Your Workflow
Workflow optimization is not a one-time project — it is an ongoing practice. Schedule a 30-minute weekly review where you examine your TBP log, identify any new overhead patterns that have emerged, and make incremental improvements. The developers who maintain the highest AI coding velocity are not those who built the best system once; they are those who treat their workflow as a codebase that requires regular refactoring and improvement.
The final insight is structural: the AI models available to developers today are already faster than human cognitive throughput. The bottleneck is entirely on the human side. Every efficiency gain in the between-prompt experience directly translates into AI capability that was always available but was being throttled by mechanical overhead. You are not making the AI better — you are finally getting out of its way.
The competitive advantage in AI-assisted development is not access to better models — it is the infrastructure to use the models you already have at their full potential throughput.
Start with TBP measurement. One hour of honest timing data will show you exactly where your workflow is bleeding velocity. From that baseline, every technique in this guide has a measurable, calculable return. The developers who build this infrastructure now are not just working faster today — they are compounding that velocity advantage daily as AI models continue to improve and the gap between AI capability and human interaction throughput continues to widen.
