
How to Track and Prevent AI Model Performance Degradation: Complete Playbook for Monitoring Codex, Claude Code, and GPT-5.6 in Production
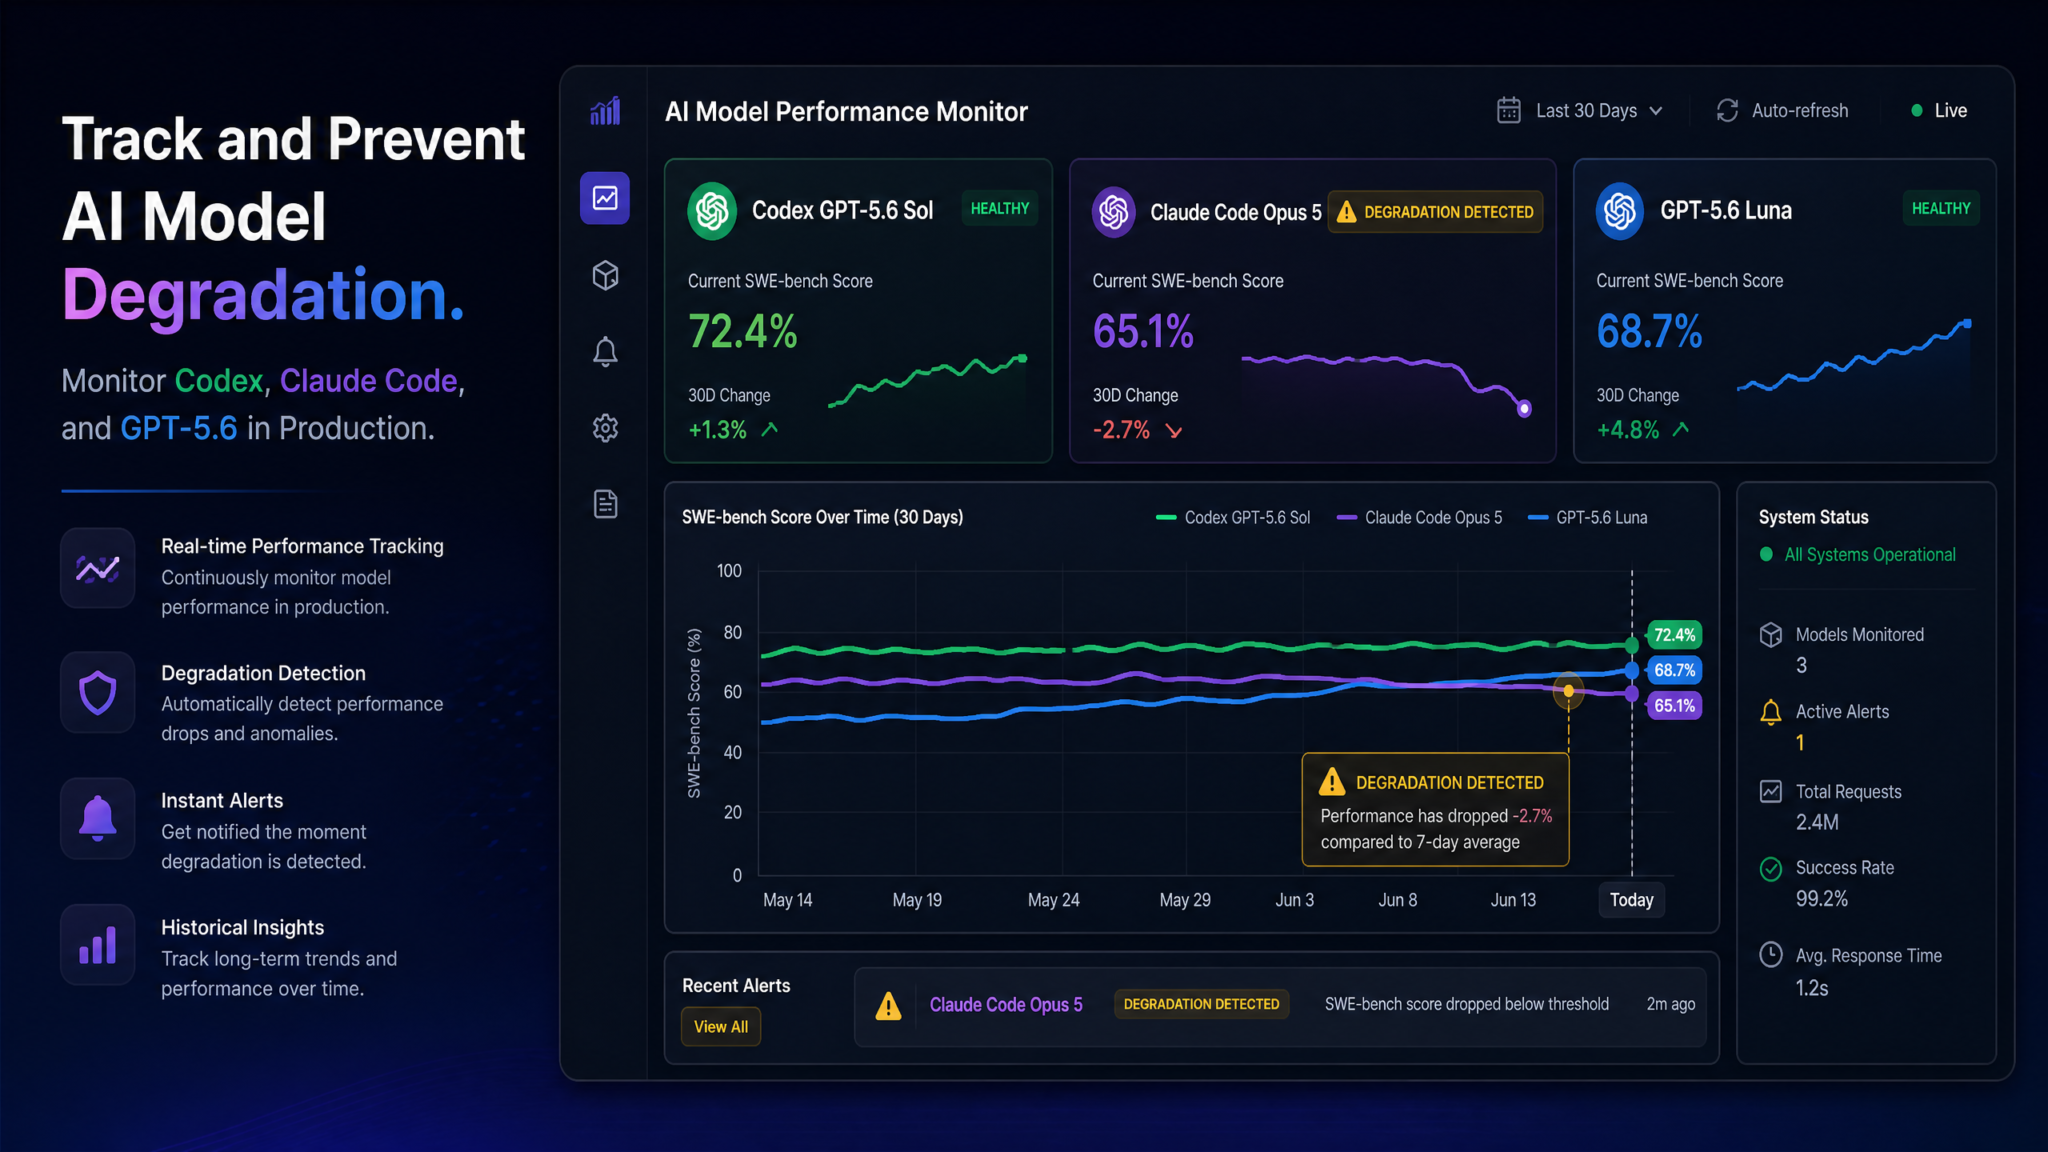
Your AI-powered application shipped perfectly. Code completion rates were above 85%, response latency sat comfortably under 2 seconds, and your engineering team was celebrating. Three weeks later, your support queue is flooded. Users complain the AI feels “dumber.” Completion quality dropped—but you have no idea when it started, how bad it’s gotten, or whether the problem is on your end or the model provider’s. This is not a hypothetical. This is the silent crisis playing out across thousands of production systems right now, and it has a name: AI model performance degradation.
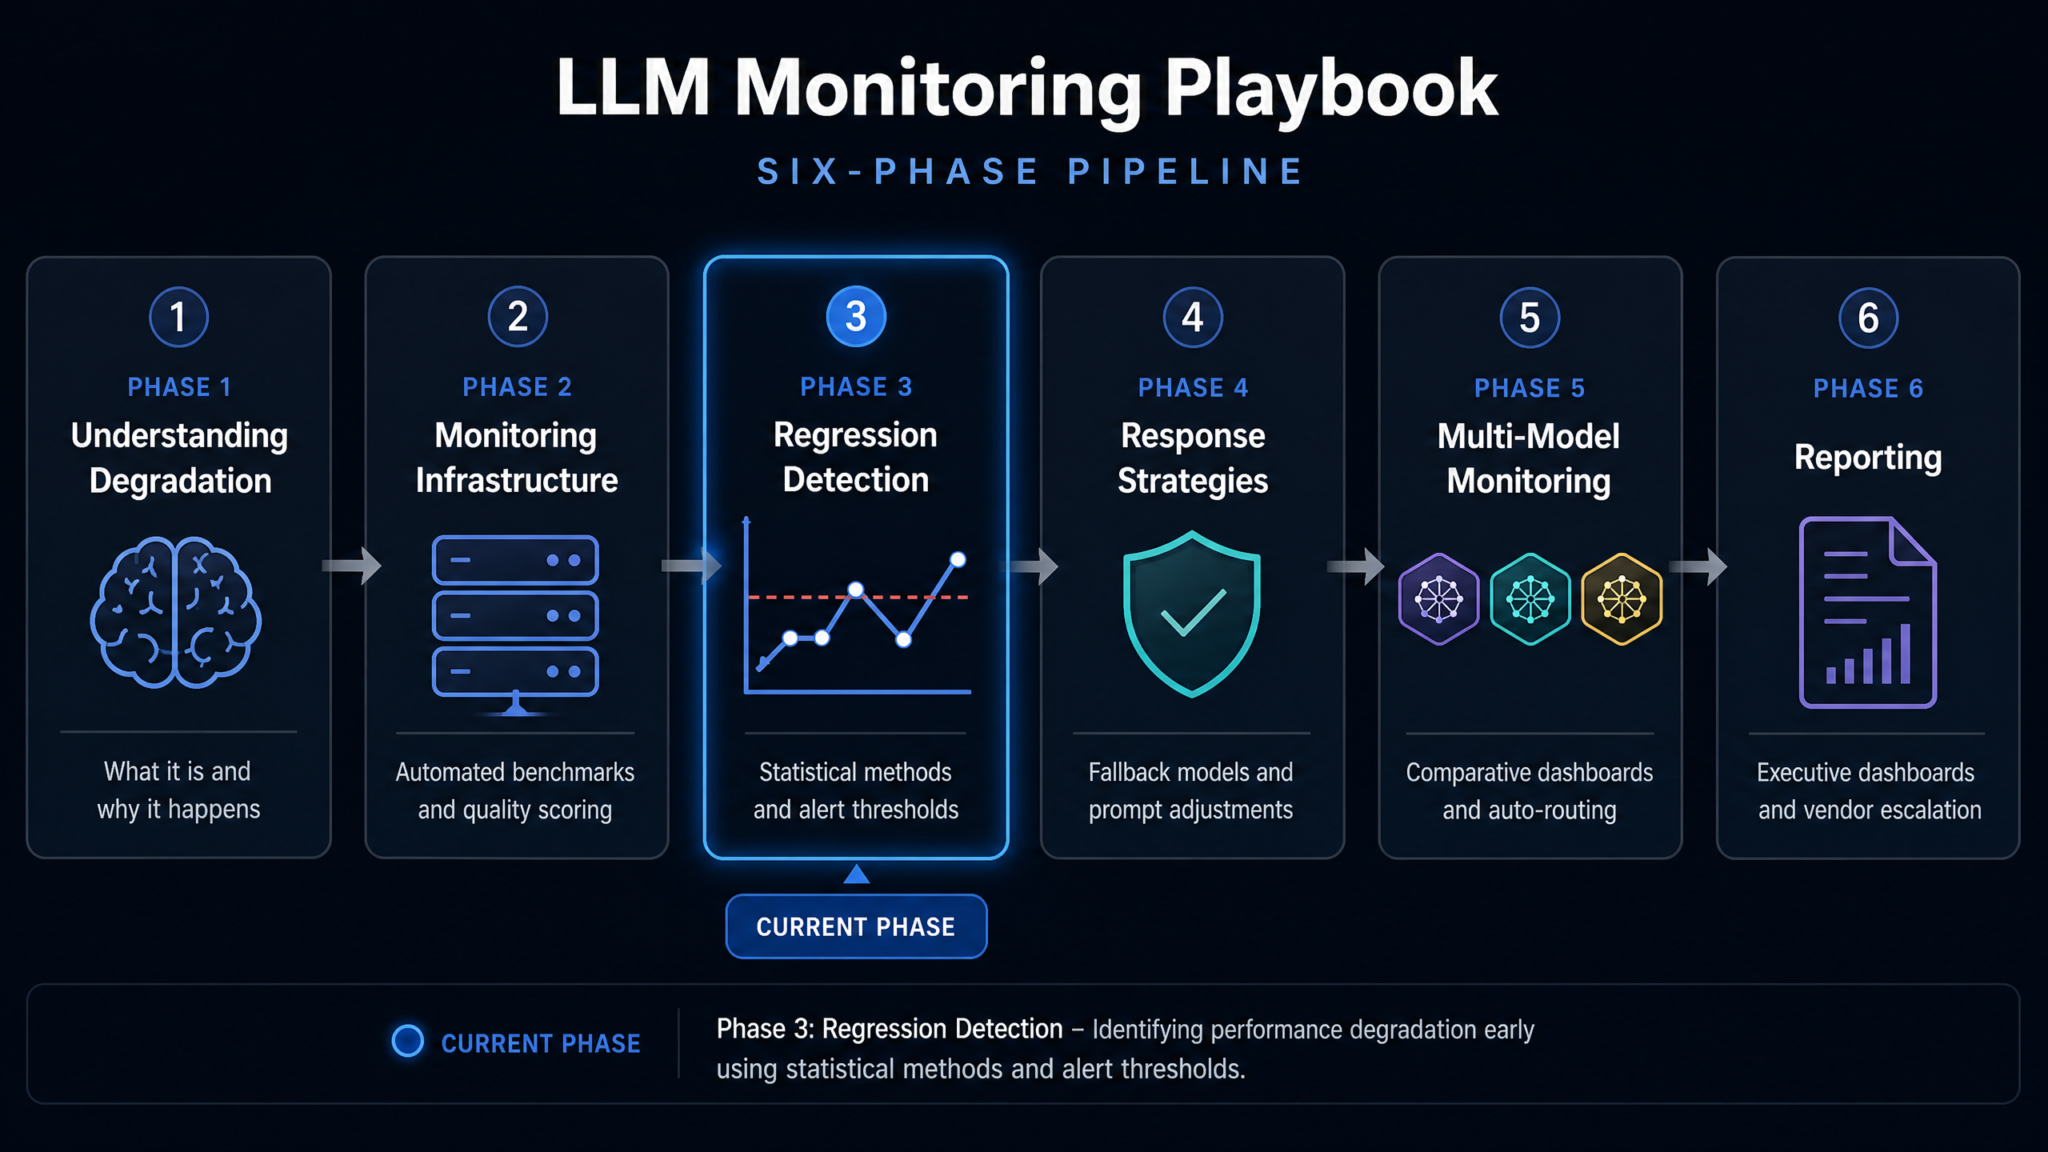
This playbook gives you every tool, metric, architectural pattern, and escalation procedure you need to detect degradation before your users do, respond systematically when it occurs, and build infrastructure resilient enough to survive provider-side changes across Codex, Claude Code, and GPT-5.6. Whether you’re running a solo SaaS product or managing a platform serving millions of AI-assisted requests per day, the six phases below will give you the operational maturity to treat model quality as a first-class production concern—tracked with the same rigor as database latency or API uptime.
Phase 1: Understanding Model Degradation — The Silent Production Crisis
What Model Degradation Actually Is
AI model performance degradation occurs when a model—accessed through an identical API endpoint with identical configuration—produces meaningfully worse outputs over time without any changes on your end. It is silent because there is no error thrown, no HTTP status code change, and no obvious signal in your logs. The model still returns 200 OK. The token count looks roughly similar. But the quality of reasoning, code correctness, instruction-following precision, or task accuracy has quietly declined.
This is categorically different from the model being wrong. A model that is consistently wrong is at least predictable. Degradation introduces variance and drift—the model performs well on some inputs, poorly on others that it previously handled correctly, and the distribution of that variance shifts over time in a direction that hurts your users.
Degradation manifests in several distinct ways depending on your use case:
- Code generation regression: Correct function implementations begin producing off-by-one errors, incorrect API usage, or syntactically broken outputs
- Instruction-following drift: A model that reliably followed complex structured output schemas now occasionally omits required fields
- Reasoning quality reduction: Multi-step logical problems that were solved correctly are now answered with shallow or incorrect reasoning chains
- Latency degradation: Average response times increase by 40–200% without explanation
- Consistency collapse: The same prompt produces wildly different quality outputs across repeated calls, increasing variance beyond acceptable thresholds
Why Degradation Happens: The Root Causes
Understanding causality is the prerequisite to building effective countermeasures. Model degradation in production systems can originate from at least six distinct sources:
1. Provider-Side Model Updates and Silent Versioning
AI providers regularly update the models behind their API endpoints. These updates may involve additional fine-tuning passes, safety filter adjustments, RLHF modifications, or changes to the inference stack. Crucially, these updates do not always increment the version identifier visible to API consumers. When OpenAI updates the model weights behind gpt-4-turbo, they are not obligated to notify you via the API. Your code calls the same endpoint and receives a different model.
This is not inherently malicious—providers are improving their models continuously. But “improvement” on aggregate benchmark scores does not guarantee improvement on your specific task distribution. A model that became better at creative writing benchmarks after a safety fine-tuning run may simultaneously have become worse at generating low-level systems programming code.
2. Infrastructure Changes and Load Balancing
At scale, model providers route requests across multiple inference clusters. These clusters may run different model versions, different quantization levels, or different hardware configurations. When load balancing shifts traffic between clusters—because one data center is experiencing load, or a new cluster is being ramped up—your traffic may suddenly hit a different effective model. This can cause seemingly random quality fluctuations that are actually deterministic but invisible from the outside.
3. Context Window and Tokenization Changes
Updates to tokenizers, changes in how system prompts are processed, or adjustments to attention mechanisms can alter how your carefully crafted prompts are interpreted. A prompt engineering strategy built on the specific tokenization behavior of one model version may produce subtly different input distributions after a tokenizer update, degrading performance without any change to your prompts.
4. Fine-Tuning Drift on Custom Models
If you are using fine-tuned models—your own or through provider-hosted customization—the base model updates underneath your fine-tune can cause catastrophic forgetting of task-specific behaviors. Even without touching your fine-tuned weights, a base model update can shift the effective behavior of your customized model in ways you did not anticipate.
5. External Data and Retrieval Drift
In RAG-augmented systems, degradation can originate in the retrieval layer. If your vector database is being updated with new documents, or embedding model versions shift, the retrieved context changes. This alters what the language model sees and can produce output quality changes that look like model degradation but are actually retrieval pipeline drift.
6. Rate Limiting and Degraded Service Modes
Under heavy load, some providers fall back to smaller, faster models to maintain throughput SLAs. Your requests may silently be served by a cheaper, lower-quality model during peak hours without any explicit notification.
Historical Examples: Why This Is Not Theoretical
The GPT-4 Degradation Controversy (2023)
In mid-2023, a significant portion of the developer community began reporting that GPT-4 had become noticeably worse at complex reasoning and coding tasks. A widely-cited study by researchers at Stanford and UC Berkeley attempted to quantify this. Their analysis of GPT-4 performance on math problem solving tasks showed accuracy dropping from approximately 97.6% in March 2023 to 2.4% by June 2023 on certain problem types—a catastrophic collapse that OpenAI attributed to safety-related model updates that changed refusal behavior, though the exact mechanism was never fully disclosed.
What made this episode particularly damaging for production teams was the absence of any official changelog. Developers who had built medical, legal, or financial reasoning applications on GPT-4’s capabilities discovered their accuracy guarantees had evaporated silently. The incident triggered widespread recognition that treating LLM APIs like deterministic software services was operationally dangerous.
Claude Performance Fluctuations (2024)
Throughout 2024, multiple teams using Claude models via Anthropic’s API reported intermittent performance fluctuations on agentic coding tasks. The Codex Sol tracker—a community-maintained benchmark dashboard—documented periods of significant variation in Claude’s performance on HumanEval tasks, with pass@1 rates fluctuating by as much as 8–12 percentage points over 30-day windows without corresponding version changes visible in the API response metadata.
Anthropic’s transparency around these variations improved significantly compared to the 2023 GPT-4 episode, but the operational impact on teams who had not built degradation monitoring was identical: unexplained drops in feature quality, user complaints, and emergency engineering effort to diagnose a problem with no obvious root cause.
Codex Sol Tracker: Ongoing Real-Time Evidence
The Codex Sol tracker, maintained by the open-source community, provides a continuous record of Codex and related coding model performance on standardized benchmarks. Its data shows that performance variations of 5–15% on HumanEval are not exceptional events—they are a routine feature of production model APIs. Teams relying on Codex for automated code generation without monitoring infrastructure have no visibility into when they fall into the low end of that performance range.
HumanEval Benchmark Explained: What AI Coding Scores Actually Mean for Production
Phase 2: Setting Up Monitoring Infrastructure
Monitoring AI model quality requires a fundamentally different toolset than traditional application performance monitoring. CPU metrics and error rates tell you nothing about whether your model is reasoning correctly. You need a dedicated quality measurement pipeline operating continuously in production.
The Four Pillars of AI Model Monitoring
Pillar 1: Automated Benchmark Suites
The foundation of your monitoring system is a set of benchmark tasks that run on a scheduled basis against your production model endpoints. These benchmarks must have known correct answers so scores can be computed automatically without human review at scale.
SWE-bench for Software Engineering Tasks: If your application involves any form of code generation, bug fixing, or software engineering assistance, SWE-bench provides a standardized evaluation suite drawn from real GitHub issues and their resolutions. A subset of SWE-bench tasks can be incorporated into your monitoring pipeline, running nightly or hourly against your production models. A drop of more than 5 percentage points in your SWE-bench score on a consistent basis should trigger an alert.
HumanEval for Function Synthesis: OpenAI’s HumanEval dataset contains 164 hand-crafted programming problems with unit tests. Running pass@1 and pass@10 evaluations against a rotating subset of these problems gives you a clean numeric signal that is well-understood in the research community, making it easy to contextualize your results against published model baselines.
Custom Task-Specific Benchmarks: Generic benchmarks capture generic capability. Your application has a specific task distribution. You need golden datasets drawn from your actual production use cases—real prompts (anonymized) with verified correct outputs. These are the benchmarks most likely to catch degradation that matters to your users before generic benchmarks show any signal.
Building a custom golden dataset requires an initial investment but pays outsized dividends:
- Export 500–1,000 representative production queries from your logs
- Generate model outputs and have domain experts score them for correctness (or use your highest-quality historical outputs as ground truth)
- Implement automated evaluation logic: exact match for structured outputs, unit tests for code, LLM-as-judge for open-ended tasks
- Store these as versioned test fixtures in your repository
Pillar 2: LLM-as-Judge for Quality Scoring
Not all outputs can be evaluated with exact match or unit tests. For open-ended reasoning, explanation quality, and conversational tasks, you need a scalable quality scoring mechanism. The LLM-as-judge pattern uses a separate, highly capable model to evaluate the outputs of your production models against defined rubrics.
A robust LLM-as-judge implementation for monitoring looks like this:
EVALUATION_PROMPT = """
You are an expert evaluator assessing AI-generated responses.

Task Description: {task_description}
Expected Behavior: {expected_behavior}

Model Response to Evaluate:
---
{model_response}
---

Score the response on each dimension from 1-5:
1. Correctness: Does the response accurately address the task?
2. Completeness: Are all required elements present?
3. Instruction Following: Does the response follow specified constraints?
4. Reasoning Quality: Is the reasoning sound and well-structured?

Return a JSON object with keys: correctness, completeness,
instruction_following, reasoning_quality, overall_score (1-5),
and justification (string).
"""
Key implementation decisions for LLM-as-judge monitoring:
- Use a different model as judge than the model being evaluated to avoid systematic bias
- Run each evaluation 3 times and take the median score to reduce judge variance
- Store raw judge outputs alongside scores for auditability
- Calibrate your judge against a human-scored validation set at setup time to measure inter-rater reliability
Pillar 3: Latency and Throughput Tracking
Latency degradation is often the leading indicator of broader model quality issues because infrastructure stress typically manifests in timing metrics before quality metrics. Your latency monitoring pipeline should track:
| Metric | Collection Method | Alert Threshold | Granularity |
|---|---|---|---|
| Time to First Token (TTFT) | Streaming response timestamp | >2× baseline p50 | Per-request |
| Total Response Latency | Request start to completion | >1.5× baseline p95 | Per-request |
| Tokens per Second (TPS) | Token count / generation time | <0.7× baseline median | Per-request |
| P99 Latency | Percentile aggregation | >10 seconds for typical requests | 5-minute windows |
| Error Rate | HTTP 5xx + timeout count | >1% of requests | 1-minute windows |
Pillar 4: Cost-Per-Task Monitoring
Model degradation can manifest economically before it manifests in quality metrics. If a model begins requiring significantly more tokens to complete equivalent tasks—because its reasoning becomes less efficient, or because you compensate for degradation by adding more context—your cost-per-task metric will rise. Track:
- Average tokens per successful task completion across your benchmark suite
- Cost per benchmark point (total spend / benchmark score) to capture the efficiency frontier
- Retry rate and retry cost—if your application logic retries failed or low-quality outputs, tracking retry frequency reveals degradation early
Infrastructure Architecture
A production-grade AI monitoring infrastructure for a team running Codex, Claude Code, and GPT-5.6 simultaneously should be structured as follows:
┌─────────────────────────────────────────────────────────────┐
│                    MONITORING ORCHESTRATOR                   │
│  (Scheduled benchmark runner — cron or Temporal workflow)   │
└────────────────────────┬────────────────────────────────────┘
                         │
         ┌───────────────┼───────────────┐
         ▼               ▼               ▼
   ┌──────────┐    ┌──────────┐    ┌──────────┐
   │  Codex   │    │  Claude  │    │ GPT-5.6  │
   │ Endpoint │    │   Code   │    │ Endpoint │
   └────┬─────┘    └────┬─────┘    └────┬─────┘
        │               │               │
        └───────────────┼───────────────┘
                        ▼
              ┌──────────────────┐
              │  Results Store   │
              │  (TimescaleDB /  │
              │   ClickHouse)    │
              └────────┬─────────┘
                       │
          ┌────────────┼────────────┐
          ▼            ▼            ▼
   ┌────────────┐ ┌─────────┐ ┌──────────┐
   │  Anomaly   │ │Grafana  │ │  Alert   │
   │  Detector  │ │Dashboard│ │  Router  │
   └────────────┘ └─────────┘ └──────────┘
Store all monitoring results in a time-series database. TimescaleDB (PostgreSQL extension) is an excellent choice because it handles time-series aggregations efficiently while allowing you to join monitoring data with your existing relational application data. ClickHouse is preferable for very high-volume monitoring at tens of thousands of benchmark evaluations per day.
Building Production AI Infrastructure: Architecture Patterns for LLM-Powered Applications
Phase 3: Building Regression Detection
Raw metrics are data. Regression detection is intelligence. The gap between a monitoring dashboard that shows you numbers and a system that tells you when something is actually wrong is filled by statistical signal processing.
Statistical Methods for Degradation Detection
Z-Score Analysis for Benchmark Scores
The z-score method compares each new benchmark result to the recent historical distribution of results for the same model and benchmark type. A z-score measures how many standard deviations a new observation falls below the mean:
z = (new_score - rolling_mean) / rolling_std_dev

Alert if: z < -2.0 (two standard deviations below mean)
Critical if: z < -3.0 (three standard deviations below mean)
Implement this with a rolling window of 30 days of benchmark data. Shorter windows are too sensitive to natural variance; longer windows are too slow to detect genuine degradation. For a practical Python implementation using your monitoring database:
import statistics

def compute_zscore_alert(model_id: str, benchmark_id: str,
                          new_score: float, history: list[float]) -> dict:
    if len(history) < 10:
        return {"status": "insufficient_data", "score": new_score}

    mean = statistics.mean(history)
    std = statistics.stdev(history)

    if std == 0:
        return {"status": "no_variance", "score": new_score}

    z = (new_score - mean) / std

    return {
        "model_id": model_id,
        "benchmark_id": benchmark_id,
        "score": new_score,
        "z_score": round(z, 3),
        "rolling_mean": round(mean, 4),
        "status": "critical" if z < -3.0 else
                  "warning" if z < -2.0 else "normal"
    }
Exponentially Weighted Moving Averages (EWMA)
EWMA gives more weight to recent observations, making it more responsive to genuine trend changes while smoothing out random noise. It is the preferred method for quality metrics that trend gradually:
EWMA_t = α × score_t + (1 - α) × EWMA_{t-1}

Recommended α values:
  α = 0.1  → heavily smoothed, detects slow trends
  α = 0.3  → balanced sensitivity (recommended for daily benchmarks)
  α = 0.6  → responsive, good for hourly monitoring
Alert when EWMA drops below a threshold equal to 92% of your established baseline EWMA computed on the first 30 days of monitoring.
Statistical Process Control: CUSUM Charts
Cumulative Sum (CUSUM) control charts are the gold standard for detecting sustained shifts in a process mean. Unlike threshold-based alerts that fire on single data points, CUSUM accumulates evidence of a shift over multiple observations, dramatically reducing false positive rates while remaining sensitive to real degradation:
# CUSUM implementation for model quality monitoring
def cusum_detector(scores: list[float], target_mean: float,
                   allowance: float = 0.5, threshold: float = 5.0) -> list[dict]:
    """
    target_mean: Expected quality score baseline
    allowance: Acceptable deviation (in std devs) before accumulation starts
    threshold: CUSUM value that triggers alert (typically 4-5)
    """
    std = statistics.stdev(scores[:30])  # calibrate on first 30 observations
    cusum_low = 0
    alerts = []

    for i, score in enumerate(scores):
        slack = allowance * std
        cusum_low = max(0, cusum_low + (target_mean - slack - score))

        if cusum_low > threshold * std:
            alerts.append({
                "index": i,
                "score": score,
                "cusum": cusum_low,
                "alert_type": "sustained_degradation"
            })
            cusum_low = 0  # reset after alert

    return alerts
Setting Alert Thresholds: What Constitutes a Significant Drop?
Threshold calibration is where most monitoring implementations fail. Set thresholds too tight and you drown in false positives; too loose and real degradation passes undetected. The following framework is based on analysis of production AI monitoring systems across multiple use cases:
| Benchmark Type | Warning Threshold | Critical Threshold | Rationale |
|---|---|---|---|
| HumanEval Pass@1 | -5% absolute | -10% absolute | High variance metric, needs wider band |
| Custom golden dataset | -3% absolute | -7% absolute | Lower variance, task-specific signal |
| LLM-as-judge overall score | -0.3 points (1-5 scale) | -0.6 points | Captures qualitative degradation |
| P50 Latency | +50% over baseline | +100% over baseline | Infrastructure degradation signal |
| Instruction following rate | -4% absolute | -8% absolute | Critical for structured output apps |
False Positive Management
A monitoring system that cries wolf loses credibility and gets disabled. Implement these false positive controls:
- Confirmation windows: Require degradation signal to persist across 3 consecutive benchmark runs before firing an alert, not just one anomalous result
- Multi-metric correlation: Alert only when two or more independent metrics degrade simultaneously (e.g., both quality score and latency)—random variance rarely affects multiple dimensions at once
- Holiday and deployment awareness: Suppress alerts during known high-traffic events or immediately after your own deployments that could legitimately explain quality changes
- Alert deduplication: If a degradation alert has fired and is under investigation, suppress duplicate alerts for the same model and benchmark combination for 24 hours
Daily vs. Weekly vs. Monthly Trend Analysis
Different time horizons reveal different types of problems:
- Hourly monitoring: Detects acute incidents—a provider infrastructure event, a sudden load-balancing shift. Metrics: latency, error rate, TTFT
- Daily monitoring: Detects short-term quality shifts from recent model updates. Metrics: benchmark scores (subset), LLM-as-judge scores
- Weekly analysis: Reveals gradual drift that is too slow for daily detection. Run full benchmark suites. Compare week-over-week and 4-week rolling windows
- Monthly reporting: Strategic view for provider negotiations, architecture decisions, and capacity planning. Includes cost-per-task trends and comparative model analysis
Statistical Methods for AI Quality Assurance: Control Charts and Drift Detection Explained
Phase 4: Response Strategies When Degradation Is Detected
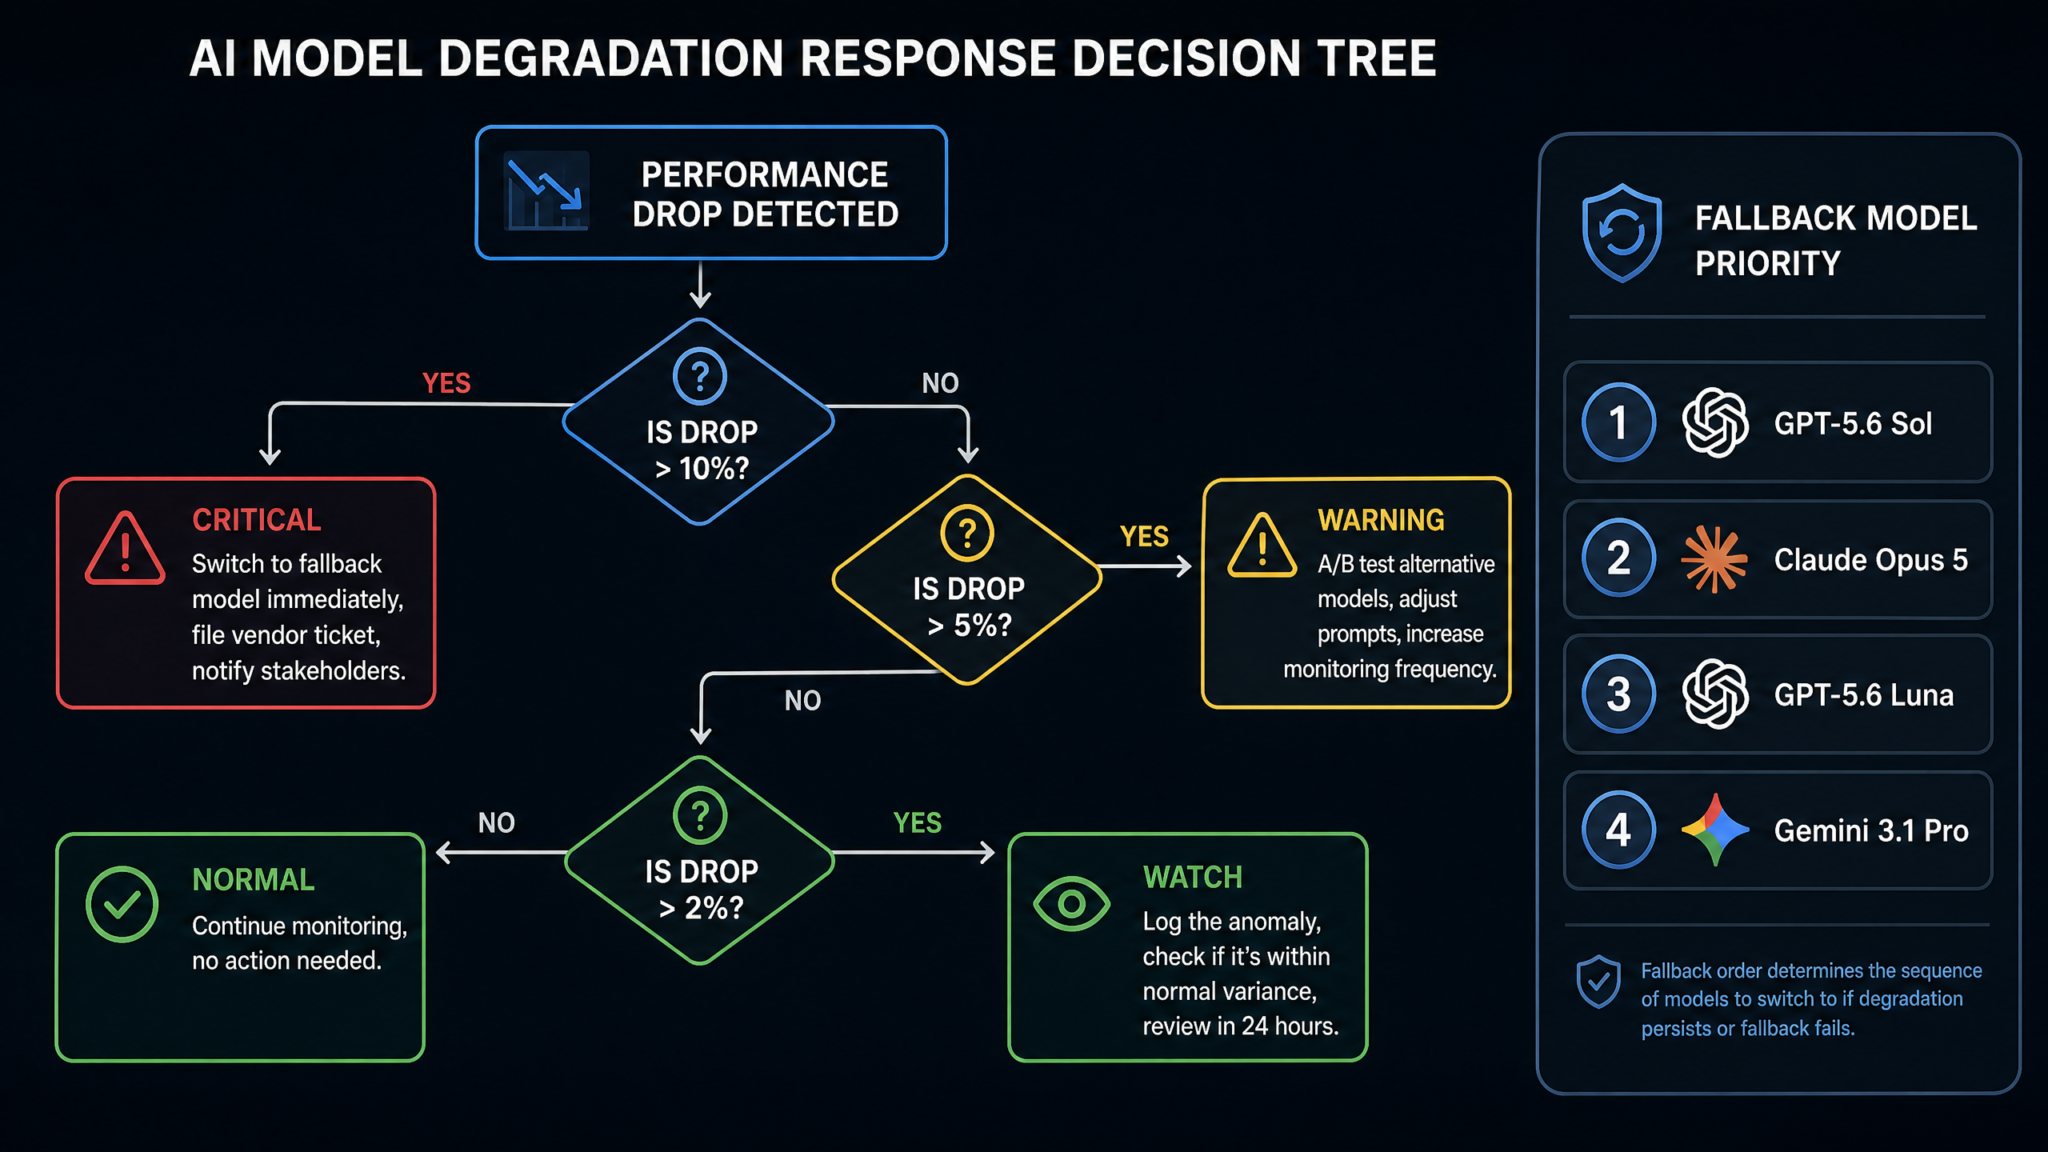
Detection without response is just expensive documentation. This phase gives you a tiered response playbook organized by urgency and time horizon.
Immediate Response (0–4 Hours): Stabilize Production
Step 1: Activate Fallback Model Routing
Your application should have pre-configured fallback model routes that can be activated via feature flag or environment variable without a deployment. When a critical degradation alert fires, the first action is routing production traffic to the best available alternative:
# Example: Feature flag-driven fallback in yourproject.io's model router
class ModelRouter:
    def __init__(self, config: RoutingConfig):
        self.primary = config.primary_model       # e.g., "gpt-5.6"
        self.fallback = config.fallback_model     # e.g., "claude-code-3.7"
        self.flags = config.feature_flags

    def select_model(self, task_type: str) -> str:
        if self.flags.get(f"fallback_{self.primary}_{task_type}", False):
            return self.fallback

        # Check real-time quality gate
        if self.quality_monitor.current_score(self.primary) < QUALITY_THRESHOLD:
            self.flags.set(f"fallback_{self.primary}_{task_type}", True)
            self.alerting.notify("AUTO_FALLBACK_ACTIVATED",
                                  primary=self.primary,
                                  fallback=self.fallback)
            return self.fallback

        return self.primary
Step 2: Prompt Adjustment and Defensive Prompting
Some degradation types respond to prompt modifications. If a model has regressed on instruction following, increasing the explicitness and redundancy of your instructions can recover quality in the short term:
- Add explicit format reminders at the end of your prompt: “Remember: your response must be valid JSON matching the schema above. Do not include any text outside the JSON object.”
- Increase the chain-of-thought scaffolding in your prompts to compensate for reduced reasoning depth
- Add few-shot examples if your prompts are currently zero-shot—degraded models often benefit more from examples than healthy models do
Step 3: Temperature and Sampling Adjustment
When model outputs become inconsistent (high variance degradation), systematically lower temperature to reduce output variance while the root cause is investigated. For code generation tasks, setting temperature to 0 or 0.1 and increasing the number of samples (pass@k evaluation) can maintain acceptable overall success rates even when per-output quality has dropped.
Short-Term Response (4–72 Hours): Diagnose and Adapt
A/B Testing Alternative Models
Once you have stabilized production, begin a structured A/B test to compare your degraded primary model against alternative providers. Route 10–20% of traffic to the alternative while monitoring both quality metrics and business outcomes (user satisfaction signals, task completion rates, session depth).
Structure your A/B test with proper controls:
Access 40,000+ AI Prompts for ChatGPT, Claude & Codex — Free!
Subscribe to get instant access to our complete Notion Prompt Library — the largest curated collection of prompts for ChatGPT, Claude, OpenAI Codex, and other leading AI models. Optimized for real-world workflows across coding, research, content creation, and business.
- Define a primary metric (e.g., golden dataset accuracy) and secondary metrics (latency, cost)
- Ensure traffic split is random and stratified by task type
- Run for a minimum of 48 hours to capture time-of-day variation
- Compute statistical significance (p-value < 0.05) before drawing conclusions
- Document results in your incident report for future reference
Filing Support Tickets with Model Providers
Escalate to your model provider with evidence, not anecdote. A well-structured support ticket significantly increases the likelihood of a useful response. Include:
- Specific benchmark: “Our HumanEval pass@1 on endpoint
gpt-5.6dropped from 82.3% to 71.1% between [date range]” - Concrete examples: 3–5 specific prompts with before/after outputs demonstrating the regression
- Request system version information: “Please confirm whether the model weights serving
gpt-5.6requests have changed since [date]” - Impact quantification: “This has affected approximately 12,000 user sessions and resulted in a 23% increase in support tickets”
Version Pinning Where Available
Some providers offer versioned endpoints. OpenAI has historically offered date-stamped model versions (e.g., gpt-4-0613) that are frozen at a specific model state. If your provider offers this and you are currently on a rolling endpoint, evaluate pinning to the last known-good version. Note that pinned versions are typically deprecated on a schedule (often 6–12 months), so this is a temporary measure, not a permanent solution.
Long-Term Response (>72 Hours): Architectural Hardening
Multi-Model Architecture Implementation
The most resilient AI production architecture does not depend on a single model provider for any critical capability. Implement a multi-model routing layer that dynamically selects the best-performing model at any given time based on current monitoring data:
class AdaptiveModelRouter:
    """Routes requests to best-performing model based on live quality data."""

    def __init__(self, models: list[ModelConfig], monitor: QualityMonitor):
        self.models = models
        self.monitor = monitor

    def route(self, task: Task) -> ModelConfig:
        eligible_models = [m for m in self.models
                           if self.monitor.is_healthy(m.model_id, task.type)]

        if not eligible_models:
            # Emergency: all models degraded, use highest-scoring regardless
            eligible_models = self.models

        # Rank by composite score: quality * 0.6 + speed * 0.2 + cost_efficiency * 0.2
        scored = [(m, self.monitor.composite_score(m.model_id, task.type))
                  for m in eligible_models]

        return max(scored, key=lambda x: x[1])[0]
Provider Diversification Strategy
Maintain active integrations with at least two model providers for each capability category in your application. The overhead of maintaining multiple integrations is significantly less than the cost of a single undetected degradation event at scale. Recommended diversification matrix:
| Capability | Primary | Secondary | Emergency Fallback |
|---|---|---|---|
| Code generation | GPT-5.6 | Claude Code | Codex (self-hosted) |
| Long-context reasoning | Claude Code | GPT-5.6 | Open-source local model |
| Structured output extraction | GPT-5.6 | Claude Code | Rule-based fallback |
| Quick completions (<100 tokens) | Codex | GPT-5.6 mini tier | Claude Haiku equivalent |
Phase 5: Multi-Model Monitoring Architecture
Monitoring three models simultaneously—Codex, Claude Code, and GPT-5.6—is not three times the work of monitoring one model. With the right architecture, it is the same work applied through a configurable, model-agnostic monitoring framework.
Model-Agnostic Benchmark Runner
Design your benchmark runner as a generic evaluation harness that accepts a model configuration and returns standardized metric objects. This allows you to add new models without rewriting evaluation logic:
@dataclass
class ModelConfig:
    model_id: str           # "gpt-5.6", "claude-code-3.7", "codex-davinci"
    provider: str           # "openai", "anthropic", "openai_legacy"
    endpoint_url: str
    api_key_env: str
    max_tokens: int
    default_temperature: float
    rate_limit_rpm: int

@dataclass
class BenchmarkResult:
    model_id: str
    benchmark_id: str
    timestamp: datetime
    score: float            # 0.0 - 1.0 normalized
    raw_scores: dict        # benchmark-specific sub-scores
    latency_p50_ms: float
    latency_p95_ms: float
    tokens_used: int
    cost_usd: float
    sample_count: int

class BenchmarkRunner:
    def run_suite(self, model: ModelConfig,
                  suite: BenchmarkSuite) -> list[BenchmarkResult]:
        results = []
        for benchmark in suite.benchmarks:
            result = self._run_benchmark(model, benchmark)
            results.append(result)
            self._store_result(result)
            self._check_alerts(result)
        return results
Comparative Dashboard Design
Your monitoring dashboard should enable three types of analysis simultaneously:
- Vertical analysis: How is model X performing against its own historical baseline?
- Horizontal analysis: How do all three models compare on this benchmark right now?
- Efficiency analysis: Which model provides the best quality-per-dollar on this task type?
The most actionable dashboard layout for a team managing Codex, Claude Code, and GPT-5.6 includes:
- Current health matrix: A 3×N grid showing each model’s current status (green/yellow/red) across N benchmark categories
- 30-day trend sparklines: Mini time-series charts for each model-benchmark combination showing whether scores are stable, improving, or declining
- Cost-efficiency scatter plot: Models plotted with quality score on the Y axis and cost-per-benchmark-unit on the X axis—the Pareto frontier makes routing decisions obvious
- Alert timeline: Chronological log of all alerts with resolution status and time-to-resolve
Automatic Routing Based on Current Performance
The ultimate expression of multi-model monitoring is a routing layer that uses live monitoring data to make model selection decisions automatically. This requires:
- A quality cache: Store the latest benchmark scores with a TTL of 1 hour. Routing decisions read from this cache rather than querying the monitoring database on every request
- Per-task-type routing tables: Maintain separate quality profiles for each task category in your application. A model that is degraded on long-form reasoning may still be excellent for short code completions
- Hysteresis to prevent flapping: Once a model is demoted from primary to secondary due to degradation, require it to score above the promotion threshold for 3 consecutive benchmark runs before restoring it to primary routing—this prevents rapid oscillation between models as scores hover around thresholds
Cost-Performance Optimization in Multi-Model Environments
Running three models simultaneously opens up cost optimization opportunities unavailable in single-model architectures. Implement tiered routing by request complexity:
- Complexity classifier: A lightweight classifier (even a simple rule-based system based on prompt length, entity count, and task type indicators) categorizes each request as low/medium/high complexity before model selection
- Low complexity: Route to the most cost-efficient model currently above quality threshold—often Codex for pure code completion tasks
- Medium complexity: Route to your current highest-quality mid-tier option
- High complexity: Route to the current highest-quality model regardless of cost, while logging for cost analysis
Teams implementing this pattern typically see 25–40% cost reductions while maintaining or improving overall quality scores because they stop over-routing simple tasks to expensive frontier models.
Multi-Model AI Architecture: When and How to Use Multiple LLM Providers in Production
Phase 6: Reporting and Communication
Monitoring data has value only when it reaches the people who can act on it, in a format they can act on. This phase covers the communication architecture that transforms your monitoring infrastructure into organizational intelligence.
Audience-Specific Communication Design
Different stakeholders need fundamentally different views of the same underlying monitoring data. Building a single dashboard and expecting all audiences to use it is how monitoring data gets ignored.
Executive Dashboard: Business Impact View
Executives need to understand AI quality in business terms, not model benchmarks. Your executive dashboard should translate technical metrics into business outcomes:
| Technical Metric | Executive Translation | Reporting Cadence |
|---|---|---|
| HumanEval pass@1 rate | Code generation success rate | Weekly |
| Golden dataset accuracy | AI feature reliability score | Weekly |
| Cost per task | AI infrastructure unit economics | Monthly |
| Degradation incidents per month | AI service stability incidents | Monthly |
| Mean time to detect degradation | AI monitoring maturity (lower = better) | Quarterly |
| Mean time to resolve degradation | AI operational resilience | Quarterly |
Developer Alerts: Actionable and Context-Rich
Developer alerts must be immediately actionable. A good alert tells you what happened, how severe it is, which system is affected, what you should do first, and where to find more information—all within a single notification. Here is a well-structured alert template:
🔴 CRITICAL: Model Degradation Detected

Model: GPT-5.6 (production endpoint)
Benchmark: Golden Dataset - Code Completion
Current Score: 71.2% (was 83.7% — 12.5% drop)
Z-Score: -3.2 (confirmed across 3 consecutive runs)
Detection Time: 2025-01-15 14:23 UTC
Affected Since: ~2025-01-15 06:00 UTC (estimated)

IMPACT:
  - Code completion feature reliability: DEGRADED
  - Estimated affected requests/hour: ~4,200
  - Auto-fallback: ACTIVATED (routing to Claude Code)

IMMEDIATE ACTIONS:
  1. Verify fallback is working: Check dashboard at /monitoring
  2. File provider ticket: Template ready at /templates/degradation
  3. Notify #ai-incidents Slack channel
  4. Begin degradation incident documentation

INVESTIGATION:
  - View degradation timeline in Grafana
  - Compare with Claude Code and Codex in the dashboard
  - Raw benchmark results in /data/benchmarks
Alert Routing Configuration
Configure alert severity routing so the right people receive the right alerts without creating notification fatigue:
# alertmanager.yml configuration for AI monitoring
route:
  group_by: ['model_id', 'benchmark_id']
  group_wait: 10m
  group_interval: 1h
  repeat_interval: 4h

  routes:
    - match:
        severity: critical
        model_type: production
      receiver: pagerduty-ai-oncall
      continue: true

    - match:
        severity: critical
      receiver: slack-ai-incidents

    - match:
        severity: warning
      receiver: slack-ai-monitoring

    - match:
        severity: info
      receiver: email-ai-weekly-digest

receivers:
  - name: pagerduty-ai-oncall
    pagerduty_configs:
      - routing_key: "${PAGERDUTY_AI_KEY}"
        description: "AI model degradation: {{ .GroupLabels.model_id }}"

  - name: slack-ai-incidents
    slack_configs:
      - channel: '#ai-incidents'
        title: 'Model Degradation Alert'
        text: "{{ template \"ai_degradation_alert\" . }}"
Vendor Escalation Procedures
A systematic vendor escalation process reduces time-to-resolution when degradation originates from the provider side. Maintain a playbook for each provider:
Standard Escalation Ladder
- Level 1 (0–4 hours): File standard API support ticket with benchmark data and example prompts. Reference your enterprise account number for priority routing
- Level 2 (4–24 hours, no response): Escalate to your designated technical account manager (TAM) if you have enterprise access. Include business impact quantification
- Level 3 (24–48 hours, unresolved): Formal escalation via enterprise account team with SLA reference. Request written confirmation of whether model weights have changed
- Level 4 (48+ hours, critical business impact): Executive escalation via your procurement relationship. Initiate contractual SLA review process
Documentation Requirements for Escalations
Maintain an escalation evidence package that can be sent to a provider immediately when Level 2+ escalation is needed:
- Timestamp-indexed benchmark score CSV showing before/after degradation
- Five representative prompt-response pairs demonstrating regression with same prompts used in both periods
- Latency percentile comparison (before/after)
- User impact quantification (sessions affected, error rate increase)
- Confirmation that the issue is model-side (not your infrastructure) by showing identical behavior from multiple geographic regions and network paths
SLA Tracking and Contractual Baseline
Most AI API providers publish uptime SLAs for availability but do not contractually guarantee quality levels. Nevertheless, track your observed quality against provider claims in technical documentation. If a provider states that their model achieves 85% on HumanEval and your monitoring consistently shows 72%, this is a meaningful discrepancy that forms the basis for vendor negotiations.
Build an SLA tracking report that includes:
- Availability SLA compliance: Measured uptime vs. contracted uptime per provider per month
- Quality baseline compliance: Average benchmark scores vs. published model capability claims
- Incident count and MTTR: Number of degradation events above warning threshold per quarter
- Cost efficiency trend: Cost per benchmark-point over time, normalized for any capability improvements
Building a Culture of AI Quality Accountability
Technical infrastructure is necessary but not sufficient. The organizations that handle AI degradation best have made quality accountability a cultural norm, not just a technical exercise. Practical steps:
- Weekly AI quality review: A standing 30-minute meeting where the AI engineering team reviews benchmark trends, open incidents, and upcoming provider changes
- Model quality OKRs: Include model quality scores in engineering OKRs, not just feature delivery metrics. “Maintain golden dataset accuracy above 80% across all production models” is a legitimate team objective
- Post-mortems for degradation incidents: Every significant degradation event should produce a written post-mortem documenting the timeline, root cause (to the extent determinable), impact, and improvements to monitoring or response playbooks
- Quarterly provider reviews: Formal review of each model provider’s performance data, reliability record, and roadmap alignment with your use case requirements
AI Vendor Management Best Practices: Evaluating and Negotiating with LLM Providers
Implementation Roadmap: From Zero to Full Monitoring in 8 Weeks
For teams starting from no AI monitoring infrastructure, this phased implementation plan minimizes disruption while delivering measurable value at each stage:
| Week | Milestone | Deliverable | Value Unlocked |
|---|---|---|---|
| 1–2 | Baseline Establishment | Golden dataset (100 items), 30-day historical benchmark run | Baseline to measure against |
| 3 | Automated Benchmark Runner | Nightly benchmark pipeline for primary model | Continuous quality visibility |
| 4 | Alert Configuration | Z-score alerts wired to Slack/PagerDuty | Proactive degradation notification |
| 5 | Fallback Routing | Feature flag-driven fallback to secondary model | Rapid incident response capability |
| 6 | Multi-Model Extension | Benchmark runner extended to all three models | Comparative intelligence for routing |
| 7 | Executive Dashboard | Business-metrics view deployed to Grafana | Organizational quality visibility |
| 8 | Adaptive Routing | Automatic model selection based on live quality data | Self-healing production AI infrastructure |
Minimum Viable Monitoring Stack
For teams with limited engineering bandwidth, this is the minimum coherent monitoring stack that delivers real protection against degradation:
- Benchmark runner: A Python script running nightly on GitHub Actions or a cron job, evaluating 50 golden dataset items per model
- Storage: A simple PostgreSQL table with columns
(model_id, benchmark_id, timestamp, score, latency_ms, cost_usd) - Alerting: A daily Slack message with the previous 24-hour benchmark scores, color-coded green/yellow/red against a 30-day rolling baseline
- Fallback: An environment variable
PRIMARY_MODEL_OVERRIDEthat can be flipped to activate a fallback without a deployment
This stack can be implemented in 3–4 days of focused engineering effort and will catch the majority of significant degradation events within 24 hours of occurrence—transforming your team from reactive to proactive on AI quality management.
Advanced Monitoring: When to Invest More
Invest in more sophisticated monitoring infrastructure—CUSUM charts, LLM-as-judge pipelines, adaptive routing—when:
- Your application serves more than 10,000 AI-assisted interactions per day
- AI feature quality is directly linked to revenue or contractual obligations
- You are running models in regulated industries where quality compliance must be demonstrable
- Your team has experienced a degradation incident that cost more than 2 weeks of engineering time to diagnose and resolve
Any of these conditions justifies the investment in a full monitoring stack. The ROI calculus is straightforward: the median cost of a significant undetected degradation incident for a production AI application is measured in weeks of engineering time, user churn, and support overhead. A monitoring infrastructure that costs 2–4 weeks of engineering time to build and 2–4 hours per week to maintain will pay for itself in the prevention of a single serious incident.
AI Application Cost Optimization: Reducing LLM API Spend Without Sacrificing Quality
Conclusion: Making AI Model Quality a First-Class Production Concern
The engineering discipline around AI model quality monitoring is exactly where web application performance monitoring was in the early 2010s—most teams knew they needed it, few had built it, and the ones who had built it had an enormous operational advantage over those who hadn’t. The difference is that AI model degradation is more insidious than server latency spikes. Latency spikes throw errors. Degradation whispers.
The six phases in this playbook—understanding degradation, building monitoring infrastructure, implementing regression detection, creating response playbooks, architecting multi-model systems, and establishing communication frameworks—represent the complete operational surface area of production AI quality management. You do not need to implement everything at once. Start with a golden dataset and a nightly benchmark runner. Add alerting. Build your fallback routing. Grow the system as your AI capability grows.
What you cannot afford to do is assume that because the API returns 200 OK, your model is performing as expected. The history of GPT-4’s 2023 degradation controversy, Claude’s 2024 performance fluctuations, and the continuous variation documented in community trackers like Codex Sol demonstrates unambiguously that model APIs are not deterministic, stable services. They are living systems operated by organizations whose optimization objectives do not perfectly align with your specific application’s quality requirements.
Your monitoring infrastructure is the contractual layer between your application’s quality commitments to your users and the probabilistic reality of AI model APIs. Build it with the same care you build your database layer, your authentication system, and your payment processing pipeline—because in an AI-native application, it is exactly that important.
The teams that build this infrastructure now will diagnose degradation incidents in hours rather than weeks, maintain quality SLAs that their competitors cannot match, and have the data to make principled provider decisions rather than reactive ones. In a market where AI-powered products are increasingly competing on quality, that operational maturity is a durable competitive advantage.
