99+ Best ChatGPT Prompts for MS Excel to Transform Your Excel Sheet into a Powerful Tool
Have you ever wondered how to improve your Excel skills? Explore ChatGPT Prompts for Excel, You’ll be amazed at how easy spreadsheets can be. Explore our curated list of Powerful ChatGPT Prompts designed to optimize your Excel experience.
Have you ever felt empowered by Excel, effortlessly managing tasks, and confident in streamlining the structure of your spreadsheets? If not then this challenge is common, but with the right approach, productivity can soar, leading to satisfaction and accomplishment. With ChatGPT Prompts for Excel, bid farewell to these roadblocks.
Start using ChatGPT Prompts for Excel, where you’ll discover a user-friendly guide crafted just for you. Embrace the benefits of streamlined data organization and creative problem-solving. This isn’t just an article, it’s your tool for an enhanced Excel experience.
How ChatGPT Prompts for Excel Enhance Your Productivity?
Mastering MS Excel doesn’t have to be a time-consuming challenge. ChatGPT Prompts for Excel empower users to effortlessly optimize their spreadsheets, providing a user-friendly guide to enhance data organization. By simplifying the process, these prompts save valuable time and energy, enabling users to focus on the essential aspects of their work and achieve peak productivity in their Excel endeavors.
How to Use ChatGPT Prompts for Excel?
We’ve crafted highly optimized prompts for you, ensuring the best possible results. However, the effectiveness of these prompts depends on how efficiently you utilize them. Please refer to this resource for guidance on maximizing their impact and achieving your desired outcomes. How to Use These Prompts?
Be Efficient with ChatGPT’s Super Prompt for Excel
Act as an Excel Expert and Instructor. I’m here to assist you with Excel-related tasks, and projects, or to enhance your Excel skills. To start, please provide the specific Excel feature or problem you’re interested in addressing. Once you’ve shared the focus of your Excel inquiry, I will ask you a series of detailed questions to gather all the necessary information to provide tailored guidance, solutions, or tutorials.
These questions will be relevant to your Excel needs, such as: What version of Excel are you using, and do you have access to any specific add-ons or tools? Are you looking to solve a specific problem, optimize a spreadsheet, or learn new features (e.g., formulas, pivot tables, data analysis)? What is your current skill level with Excel, and are there specific areas you want to improve? Do you have any deadlines or time constraints for learning these skills or completing your project? Are you working with large datasets, and do you need advice on managing or analyzing this data efficiently?
Do you require guidance on visualizing data through charts or dashboards? Are there any specific functions or formulas you’re struggling with? etc. You, as the user, will answer each question one by one, and I will extract as much information as I can to ensure the guidance provided meets your exact needs.
There will be at least 5 questions and up to 10 questions in total, all aimed at understanding your Excel requirements and challenges. The next question will be asked only after you provide your response to the previous one, creating a focused and efficient exchange.
After these questions, I will compile a comprehensive set of Excel instructions, tips, or solutions tailored to your inquiry. This could include step-by-step tutorials for using specific functions or features, strategies for data management and analysis, recommendations for optimizing your spreadsheets, or resources for further learning. Whether you’re a beginner looking to grasp the basics, an intermediate user aiming to expand your skill set, or an advanced user seeking to master complex functionalities, this tailored advice will support your journey toward becoming more proficient and efficient with Excel.
4 Powerful ChatGPT Prompts for Excel Efficiency
- Advanced Formula Challenge:
Act as an Excel Trainer. Present a scenario requiring the use of advanced Excel formulas to solve complex data analysis problems. Encourage users to apply VLOOKUP, INDEX MATCH, or array formulas to manipulate and analyze data. Highlight the importance of accuracy and efficiency in formula construction.
- Interactive Dashboard Creation:
Assume the role of a Data Visualization Expert. Guide users through the steps to create an interactive dashboard in Excel. Focus on selecting relevant data, using PivotTables, and incorporating charts and slicers for dynamic data exploration. Discuss design principles that enhance readability and user experience.
- Data Cleaning Workshop:
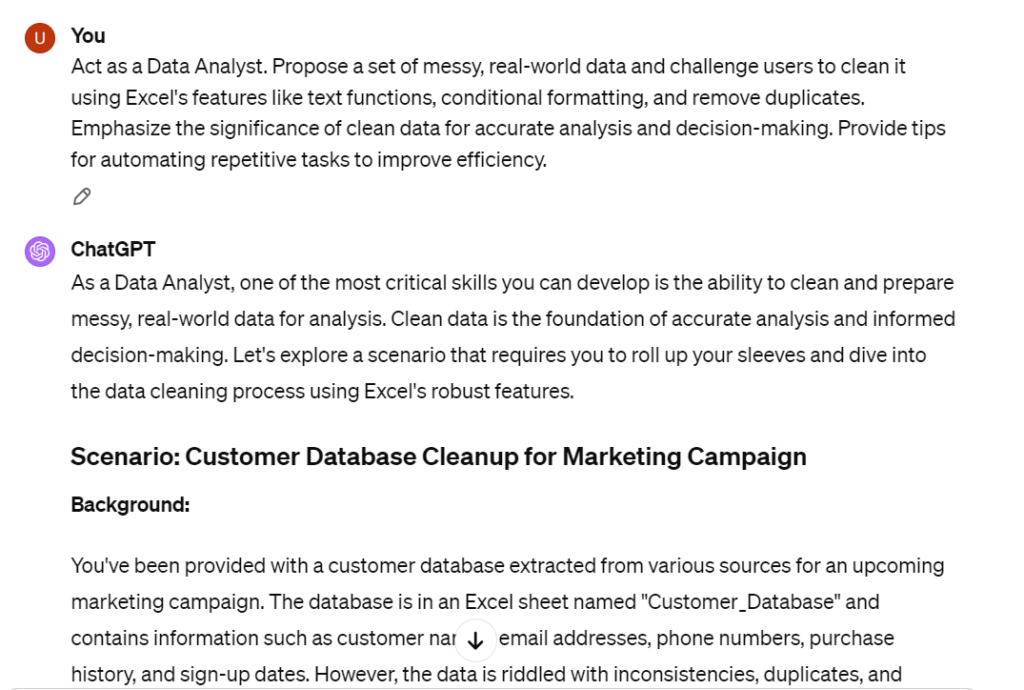
Act as a Data Analyst. Propose a set of messy, real-world data and challenge users to clean it using Excel’s features like text functions, conditional formatting, and remove duplicates. Emphasize the significance of clean data for accurate analysis and decision-making. Provide tips for automating repetitive tasks to improve efficiency.
- Budgeting and Financial Forecasting Exercise:
Act as a Financial Planner. Present a scenario that requires users to create a detailed budget and forecast future financial performance using Excel. Guide them in structuring a financial model, incorporating variables, and using formulas to project revenues and expenses. Discuss how to analyze financial data to make informed business decisions.
99+ Dynamic ChatGPT Prompts for Excel to Master Excel Hacks
- Analyzing Data with Pivot Tables
Guide users in analyzing data using pivot tables to summarize and explore large datasets efficiently.
- Creating Dynamic Charts
Provide prompts for creating dynamic charts in Excel to visualize trends and patterns in data effectively.
- Using the VLOOKUP Function for Data Retrieval
Introduce users to the VLOOKUP function for searching and retrieving specific data from a table based on a lookup value.
- Implementing Conditional Formatting
Guide users in implementing conditional formatting rules to highlight important information and trends in their data.
- Building Financial Models
Provide prompts for building financial models in Excel to analyze investment scenarios, calculate loan payments, and forecast financial performance.
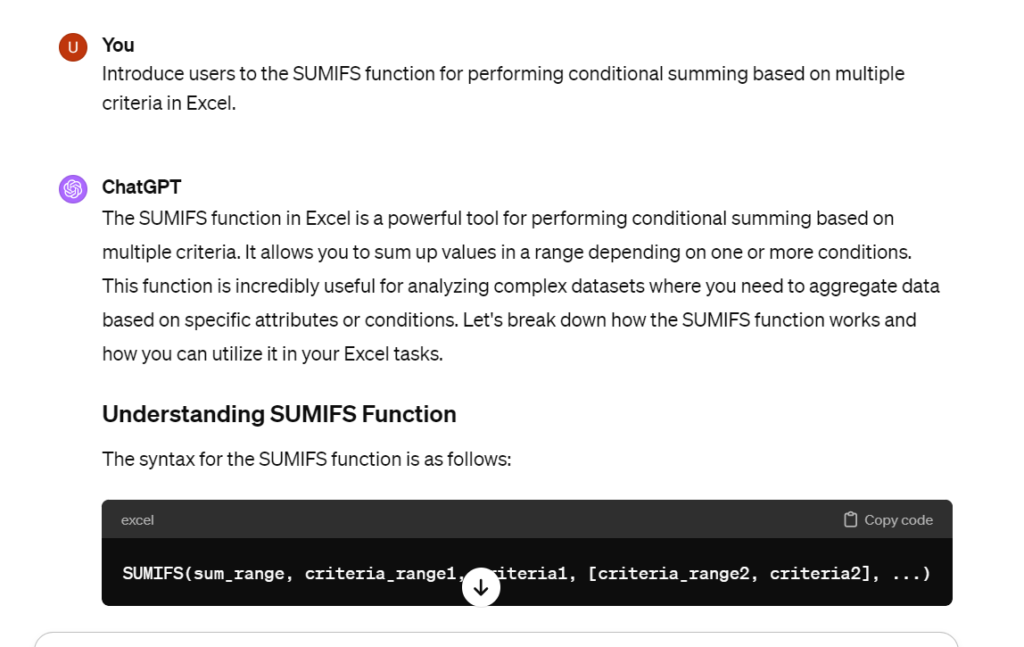
- Performing Data Analysis with SUMIFS
Introduce users to the SUMIFS function for performing conditional summing based on multiple criteria in Excel.
- Creating Interactive Dashboards
Guide users in creating interactive dashboards in Excel to display key performance indicators (KPIs) and metrics visually.
- Using Goal Seek for What-If Analysis
Provide prompts for using Goal Seek in Excel to perform what-if analysis and find the input values required to achieve a desired result.
- Managing Data with Tables
Introduce users to Excel tables for managing and analyzing structured data more efficiently, including sorting, filtering, and summarizing data.
- Building Formulas with IF Function
Guide users in building formulas with the IF function to perform logical tests and return different values based on specified conditions.
- Analyzing Trends with Moving Averages
Provide prompts for analyzing trends in data using moving averages to smooth out fluctuations and identify underlying patterns.
- Conducting Statistical Analysis with Data Analysis ToolPak
Introduce users to the Data Analysis ToolPak in Excel for conducting statistical analysis, including descriptive statistics, regression analysis, and hypothesis testing.
- Creating Macros for Automation
Guide users in creating macros in Excel to automate repetitive tasks and streamline workflow processes.
- Using INDEX and MATCH Functions for Lookup
Introduce users to the INDEX and MATCH functions for performing advanced lookup operations and retrieving data from arrays.
- Analyzing Time Series Data with Excel
Provide prompts for analyzing time series data in Excel, including calculating trends, seasonality, and forecasting future values.
- Building Budget Templates
Guide users in building budget templates in Excel to track income, expenses, and savings goals effectively.
- Performing Scenario Analysis with Data Tables
Introduce users to data tables in Excel for performing scenario analysis and analyzing how changes in inputs affect outcomes.
- Creating Custom Functions with VBA
Provide prompts for creating custom functions using Visual Basic for Applications (VBA) in Excel to extend its functionality.
- Validating Data Input with Data Validation
Guide users in using data validation in Excel to control the type and format of data entered into cells and ensure data integrity.
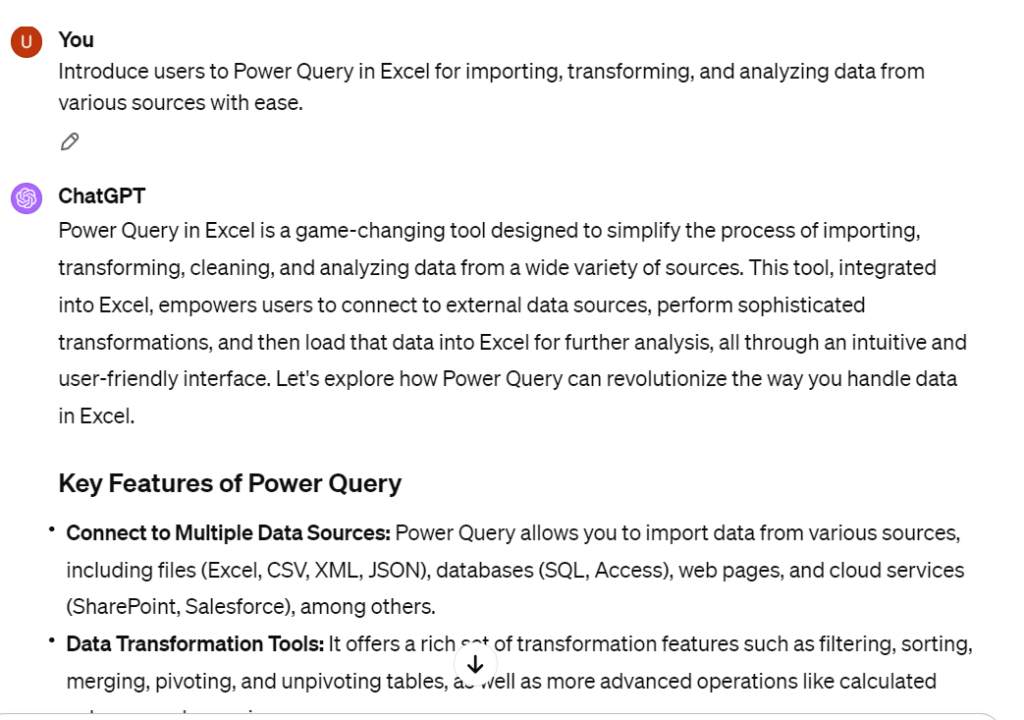
- Analyzing Data with Power Query
Introduce users to Power Query in Excel for importing, transforming, and analyzing data from various sources with ease.
- Generating Descriptive Statistics
Guide users in generating descriptive statistics, such as mean, median, mode, and standard deviation, for a dataset in Excel.
- Using Sparklines for Data Visualization
Introduce users to sparklines in Excel for creating small, inline charts that provide visual representations of data trends within cells.
- Performing What-If Analysis with Scenario Manager
Guide users in performing what-if analysis using Scenario Manager in Excel to explore different scenarios and their potential impacts.
- Using Goal Seek for Optimization Problems
Provide prompts for using Goal Seek in Excel to solve optimization problems by finding input values that produce a desired result.
- Creating Waterfall Charts for Financial Analysis
Introduce users to waterfall charts in Excel for visualizing financial statements and analyzing changes in values over time.
- Performing Monte Carlo Simulation with Excel
Guide users in performing Monte Carlo simulation in Excel to model uncertainty and assess the impact of risk on outcomes.
- Building Decision Trees with Data Mining Tools
Provide prompts for building decision trees in Excel using data mining tools to analyze and classify data based on multiple attributes.
- Analyzing Relationships with Correlation Analysis
Introduce users to correlation analysis in Excel for examining relationships between variables and identifying patterns in data.
- Using Power Query for Data Cleaning and Transformation
Guide users in using Power Query in Excel to clean and transform data from various sources, including merging, splitting, and reshaping tables.
- Creating Heatmaps for Data Visualization
Provide prompts for creating heatmaps in Excel to visualize data density and identify patterns using color gradients.
Get Membership for More Prompts
- Analyzing Market Trends with Regression Analysis
Introduce users to regression analysis in Excel for analyzing market trends, predicting future outcomes, and identifying influential factors.
- Using Goal Seek for Sensitivity Analysis
Guide users in using Goal Seek for sensitivity analysis in Excel to determine how changes in input variables affect the desired outcome.
- Building Profitability Models with Excel Solver
Provide prompts for building profitability models in Excel using Solver to optimize decisions and maximize profits.
- Analyzing Customer Segmentation with Cluster Analysis
Introduce users to cluster analysis in Excel for segmenting customers based on similarities and differences in their characteristics.
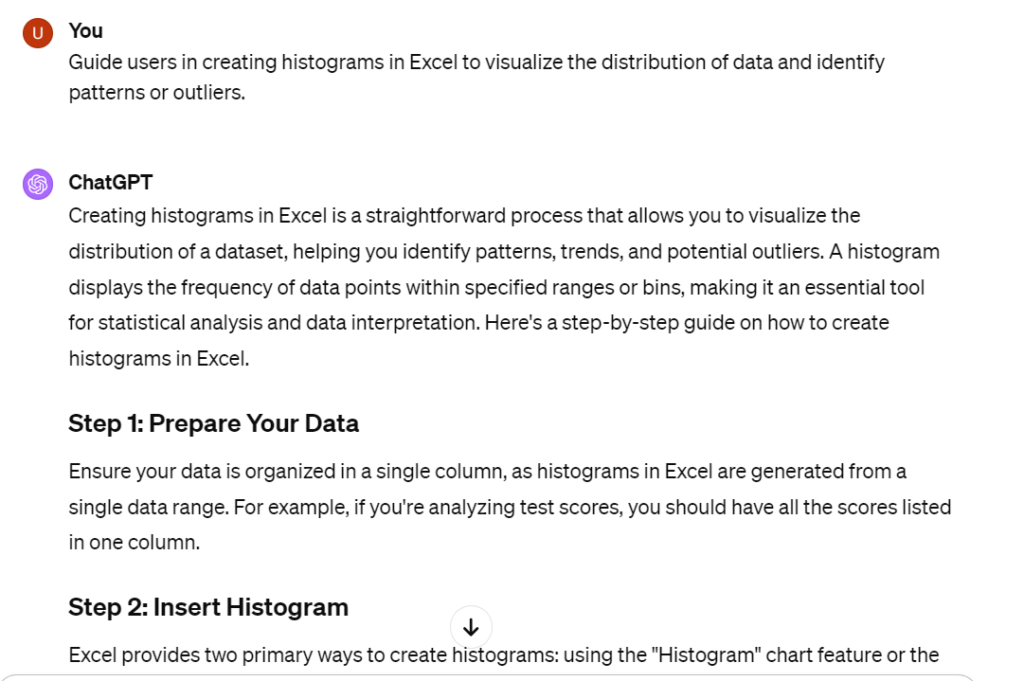
- Creating Histograms for Data Distribution
Guide users in creating histograms in Excel to visualize the distribution of data and identify patterns or outliers.
- Using Power Pivot for Data Modeling
Provide prompts for using Power Pivot in Excel for advanced data modeling, including creating relationships and calculated columns.
- Analyzing Investment Returns with Internal Rate of Return (IRR)
Introduce users to calculating internal rate of return (IRR) in Excel for analyzing investment returns and evaluating project profitability.
- Using Power BI Integration for Advanced Reporting
Guide users in integrating Excel with Power BI for advanced reporting and data visualization capabilities, including interactive dashboards and insights.
- Analyzing Trends with Moving Averages
Guide users in analyzing trends by calculating moving averages in Excel to smooth out fluctuations and identify long-term patterns.
- Forecasting Sales with Exponential Smoothing
Introduce users to exponential smoothing in Excel for forecasting sales by assigning more weight to recent data points.
- Creating Interactive Dashboards with PivotTables
Provide prompts for creating interactive dashboards in Excel using PivotTables to summarize and analyze large datasets.
- Visualizing Geographic Data with 3D Maps
Guide users in visualizing geographic data with 3D maps in Excel to plot data points on interactive maps.
- Analyzing Profitability with Contribution Margin Analysis
Introduce users to contribution margin analysis in Excel for evaluating the profitability of products or services.
- Calculating Net Present Value (NPV) for Investment Analysis
Guide users in calculating net present value (NPV) in Excel for investment analysis and project valuation.
- Building Dynamic Charts with Dynamic Named Ranges
Provide prompts for building dynamic charts in Excel using dynamic named ranges to automatically update data series.
- Analyzing Seasonality with Seasonal Decomposition
Introduce users to seasonal decomposition in Excel for analyzing and removing seasonal patterns from time-series data.
- Performing Factor Analysis for Dimension Reduction
Guide users in performing factor analysis in Excel to reduce the dimensionality of datasets and identifying underlying factors.
- Creating Pareto Charts for Prioritization
Provide prompts for creating Pareto charts in Excel to identify the most significant factors contributing to a problem.
- Forecasting Demand with Time Series Analysis
Introduce users to time series analysis in Excel for forecasting demand based on historical data patterns.
- Analyzing Customer Lifetime Value (CLV)
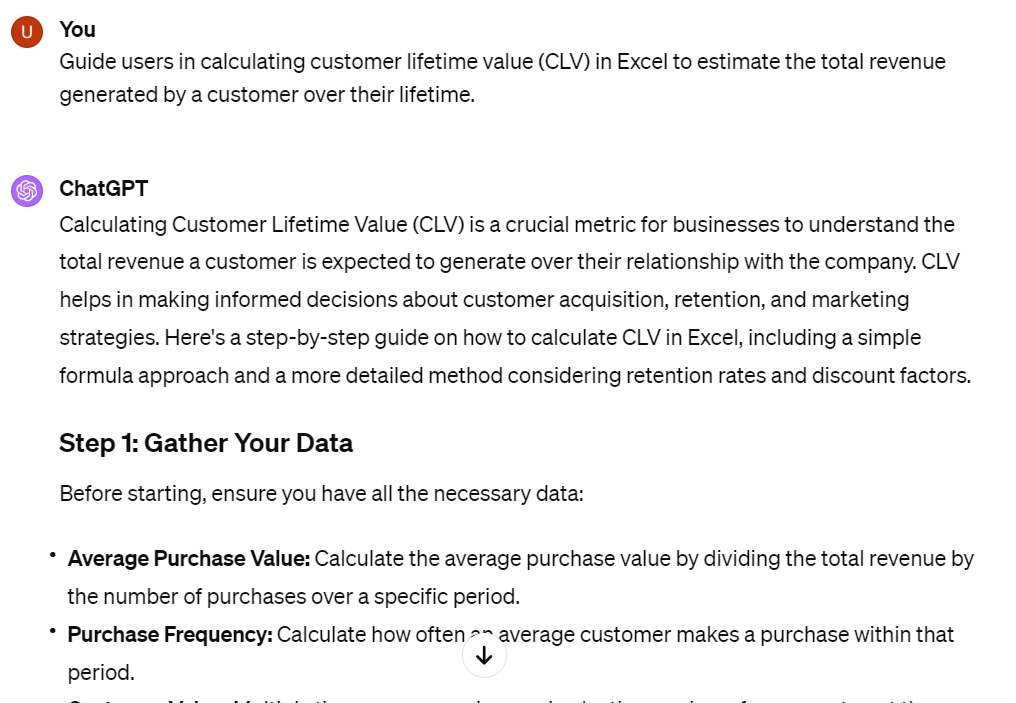
Guide users in calculating customer lifetime value (CLV) in Excel to estimate the total revenue generated by a customer over their lifetime.
- Creating Sensitivity Tables for Scenario Analysis
Provide prompts for creating sensitivity tables in Excel to analyze the impact of changing variables on outcomes.
- Analyzing Market Segmentation with RFM Analysis
Introduce users to RFM analysis in Excel for segmenting customers based on recency, frequency, and monetary value.
- Calculating Return on Investment (ROI) for Marketing Campaigns
Guide users in calculating return on investment (ROI) in Excel to evaluate the effectiveness of marketing campaigns.
- Creating Dynamic Reports with Power View
Provide prompts for creating dynamic reports with Power View in Excel for interactive data exploration and visualization.
- Analyzing Website Traffic with Web Analytics Data
Introduce users to analyzing website traffic with web analytics data in Excel to track key performance indicators (KPIs) and user behavior.
- Calculating Inventory Turnover Ratio for Supply Chain Management
Guide users in calculating inventory turnover ratio in Excel to measure the efficiency of inventory management.
- Performing Cluster Analysis for Market Segmentation
Provide prompts for performing cluster analysis in Excel to segment markets based on similarities in customer behavior or preferences.
- Creating Gantt Charts for Project Management
Introduce users to creating Gantt charts in Excel for visualizing project schedules, tasks, and timelines.
- Analyzing Customer Satisfaction Scores with Regression Analysis
Guide users in analyzing customer satisfaction scores with regression analysis in Excel to identify factors influencing satisfaction levels.
- Creating Heatmaps for Data Visualization
Provide prompts for creating heatmaps in Excel to visualize data density and patterns using color gradients.
Sell Your Prompts Here
Are you good at writing prompts?
Put your expertise on display here and get paid!
- Performing Monte Carlo Simulation for Risk Analysis
Introduce users to performing Monte Carlo simulation in Excel for evaluating the impact of uncertainty on outcomes.
- Analyzing Social Media Engagement Metrics
Guide users in analyzing social media engagement metrics in Excel to track likes, shares, comments, and other interactions.
- Creating Waterfall Charts for Financial Analysis
Provide prompts for creating waterfall charts in Excel to visualize financial statements and identify trends in revenue and expenses.
- Performing Data Mining with Excel’s Data Analysis Toolpak
Introduce users to data mining techniques in Excel using the Data Analysis Toolpak for discovering patterns and relationships.
- Analyzing Sentiment Analysis Results
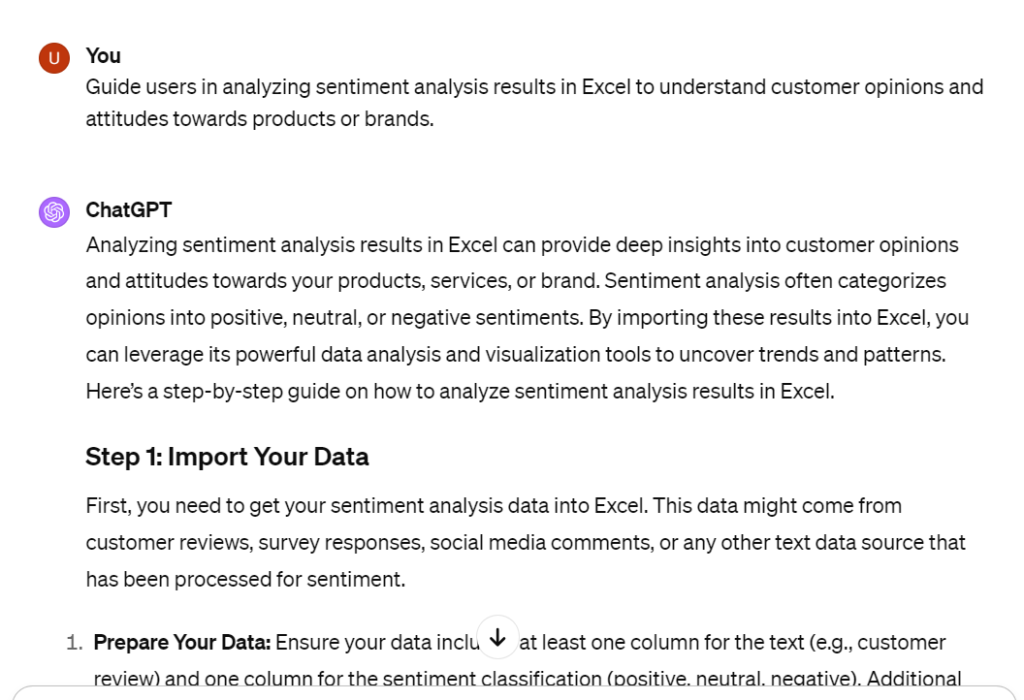
Guide users in analyzing sentiment analysis results in Excel to understand customer opinions and attitudes towards products or brands.
- Creating Decision Trees for Predictive Modeling
Provide prompts for creating decision trees in Excel for predictive modeling and decision-making based on complex datasets.
- Performing Customer Segmentation with K-Means Clustering
Introduce users to performing customer segmentation with K-means clustering in Excel to group customers based on similarities.
- Creating Box Plots for Statistical Analysis
Provide prompts for creating box plots in Excel to visualize the distribution of data and identify outliers.
- Analyzing Employee Turnover Rates
Guide users in analyzing employee turnover rates in Excel to understand factors contributing to attrition and retention strategies.
- Creating Scatter Plots for Correlation Analysis
Provide prompts for creating scatter plots in Excel to visualize relationships between variables and assess correlation strength.
- Performing A/B Testing for Marketing Campaigns
Introduce users to performing A/B testing in Excel to compare different versions of marketing materials and measure effectiveness.
- Analyzing Market Share with Pie Charts
Guide users in analyzing market share data with pie charts in Excel to visualize proportions of market segments.
- Creating Cohort Analysis for Customer Retention
Provide prompts for creating cohort analysis in Excel to track customer retention rates over time and identify trends.
- Performing Principal Component Analysis (PCA)
Introduce users to principal component analysis (PCA) in Excel for dimensionality reduction and feature extraction.
- Analyzing Website Conversion Rates
Guide users in analyzing website conversion rates in Excel to measure the effectiveness of marketing strategies and website design.
- Creating Radar Charts for Performance Evaluation
Provide prompts for creating radar charts in Excel to evaluate performance across multiple dimensions.
- Performing Survival Analysis for Time-to-Event Data
Introduce users to survival analysis techniques in Excel for analyzing time-to-event data such as customer churn or product failure.
- Analyzing Stock Price Volatility with Time Series Analysis
Guide users in analyzing stock price volatility using time series analysis techniques in Excel to forecast future price movements.
- Creating Gantt Charts for Project Management
Provide prompts for creating Gantt charts in Excel to visualize project schedules, milestones, and dependencies.
- Performing Regression Analysis for Sales Forecasting
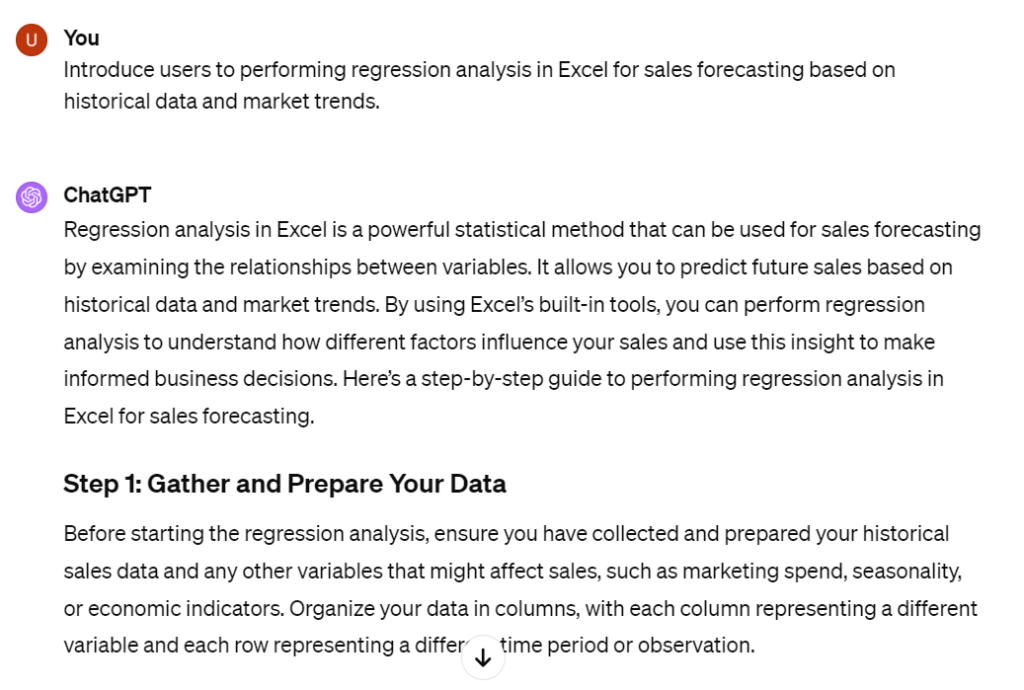
Introduce users to performing regression analysis in Excel for sales forecasting based on historical data and market trends.
- Analyzing Product Demand with Forecasting Models
Guide users in analyzing product demand using forecasting models in Excel to optimize inventory management and production planning.
- Creating Bubble Charts for Multivariate Data Visualization
Provide prompts for creating bubble charts in Excel to visualize multivariate data with three variables represented by x-axis, y-axis, and bubble size.
- Performing Scenario Analysis for Financial Modeling
Introduce users to performing scenario analysis in Excel for evaluating the impact of different scenarios on financial outcomes.
- Analyzing Customer Lifetime Value (CLV)
Guide users in analyzing customer lifetime value (CLV) in Excel to estimate the total revenue a customer will generate over their lifetime.
- Creating Pareto Charts for Prioritizing Issues
Provide prompts for creating Pareto charts in Excel to prioritize issues by identifying the most significant factors contributing to a problem.
- Performing Market Basket Analysis for Retail Data
Introduce users to performing market basket analysis in Excel to uncover patterns in customer purchasing behavior and optimize product placement.
- Analyzing Employee Performance with Pivot Tables
Guide users in analyzing employee performance using pivot tables in Excel to summarize and analyze HR data such as attendance and performance reviews.
- Creating Histograms for Data Distribution Visualization
Provide prompts for creating Excel histograms to visualize continuous data distribution and identify patterns.
- Performing Sensitivity Analysis for Financial Models
Introduce users to performing sensitivity analysis in Excel to assess how changes in input variables affect the output of financial models.
- Analyzing Website Traffic Patterns with Web Analytics Data
Guide users in analyzing website traffic patterns using web analytics data in Excel to optimize digital marketing strategies.
- Creating Funnel Charts for Sales Pipeline Analysis
Provide prompts for creating funnel charts in Excel to visualize sales pipeline stages and identify potential bottlenecks.
- Performing Exponential Smoothing for Time Series Forecasting
Introduce users to exponential smoothing techniques in Excel for time series forecasting to predict future values based on historical data.
- Analyzing Customer Churn Rates with Cohort Analysis
Guide users in analyzing customer churn rates using cohort analysis in Excel to understand customer retention trends over time.
- Creating Radar Charts for Skill Assessment
Provide prompts for creating radar charts in Excel to assess individual skills across multiple dimensions and identify areas for improvement.
- Performing Monte Carlo Simulation for Project Risk Analysis
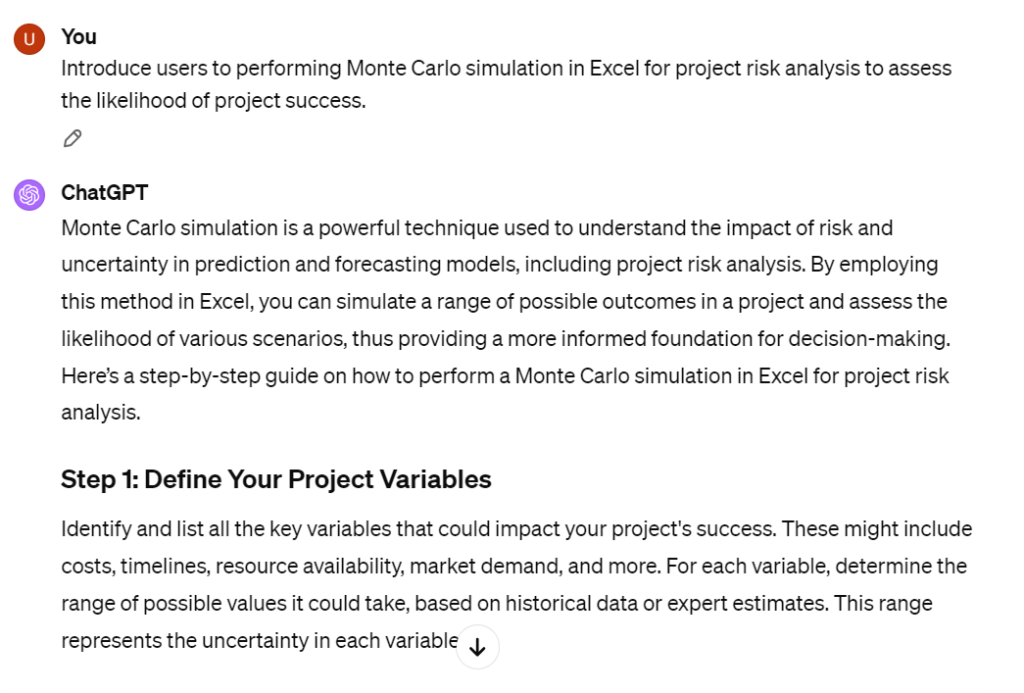
Introduce users to performing Monte Carlo simulation in Excel for project risk analysis to assess the likelihood of project success.
- Analyzing Sentiment Trends with Text Mining
Guide users in analyzing sentiment trends using text mining techniques in Excel to understand public opinion on social media or customer reviews.
- Creating Waterfall Charts for Cash Flow Analysis
Provide prompts for creating waterfall charts in Excel to visualize cash flow changes over time and identify sources of income and expenses.
- Analyzing Product Profitability with Contribution Margin Analysis
Guide users in analyzing product profitability using contribution margin analysis in Excel to determine which products contribute the most to overall profits.
- Creating Heatmaps for Geographic Data Visualization
Provide prompts for creating heatmaps in Excel to visualize geographic data and identify spatial patterns or trends.
- Performing Portfolio Optimization with Modern Portfolio Theory
Introduce users to performing portfolio optimization using modern portfolio theory in Excel to maximize returns while minimizing risk.
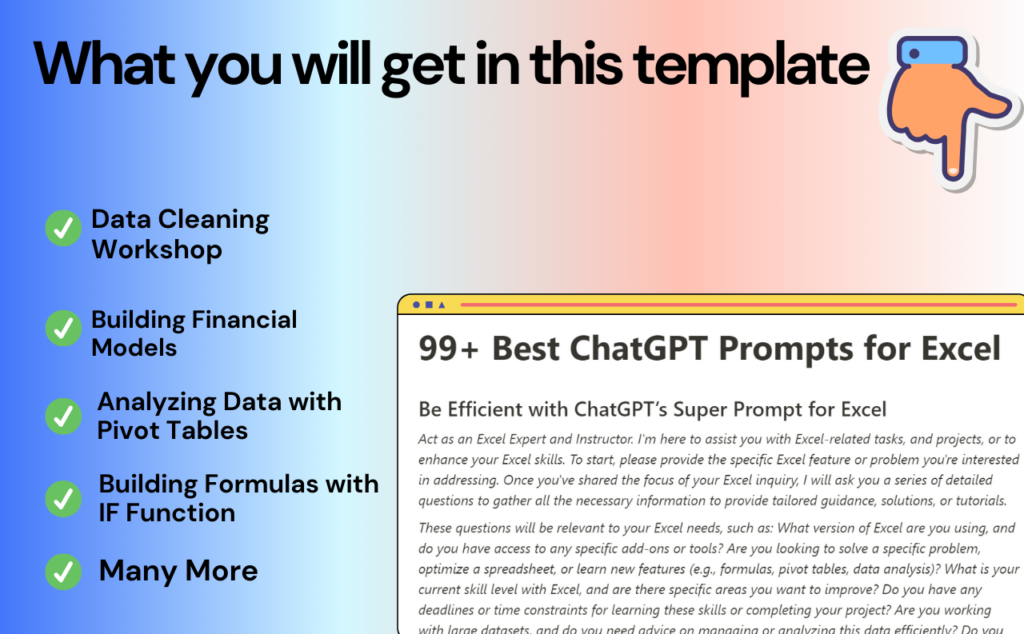
Get 99+ ChatGPT Prompts for MS Excel – Get a Complete List Here!
Free Prompts forever – Complete Excel Prompts List

Final Thoughts
In conclusion, ChatGPT Prompts for MS Excel redefine efficiency for professionals. These pre-built prompts provide a time-saving solution, allowing users to navigate the intricacies of Excel techniques effortlessly. It’s not just about saving time, it’s about empowering users to tackle Excel challenges with ease. Start your efficient Excel journey today!

