
20 ChatGPT Prompts for Startup Founders: Pitch Decks, Financial Models, and Investor Communications

20 ChatGPT Prompts for Startup Founders: The Complete 2026 Guide to Pitch Decks, Financial Modeling, Investor Relations, and Growth
Published: August 2, 2026 | Category: Prompts, Startup, Business
Startup founders operate in a relentless environment where every hour counts and every decision carries outsized consequences. In 2026, the founders who consistently outperform their peers are not working harder — they are working smarter by deploying AI as a genuine co-founder, not just a writing assistant. The difference between a founder who uses ChatGPT to generate generic content and one who uses precisely engineered prompts to produce investor-grade deliverables is the difference between noise and signal.
This guide delivers 20 battle-tested ChatGPT prompts across five mission-critical startup functions: pitch deck creation, financial modeling, investor communications, market research, and operations and growth. Each prompt has been designed with the specificity that separates professional AI output from mediocre output. You will find the full prompt text, context on when to deploy it, an example output snippet, and customization tips that let you adapt each prompt to your specific industry, stage, and audience.
Before diving in, understand one foundational principle: the quality of your AI output is a direct function of the context you provide. A founder who tells ChatGPT “write me a pitch deck” will receive something generic and unusable. A founder who provides their industry vertical, funding stage, target investor profile, key metrics, and competitive differentiation will receive something that requires only light editing before it lands in front of a Tier 1 VC. Every prompt in this guide is built on that principle. For a deeper understanding of this concept, see our guide on The Codex Prompt Engineering Playbook: 15 Prompts for Optimizing AI-Generated Code Quality, Reducing Hallucinations, and Improving Test Coverage.
GPT Model Comparison by Category
Not all ChatGPT models are equally suited to every startup task. As of August 2026, OpenAI’s model lineup includes GPT-4o, GPT-4o with Advanced Reasoning (o3), and the specialized o3-mini. Understanding which model to use for which task will save you time and produce materially better output. For a broader overview of using AI in a business context, see our resource on The Complete Guide to OpenAI’s ChatGPT Small Business Program: AI Training, Mentorship, and Growth Tools for Entrepreneurs.
| Category | Best Model | Why | Alternative | Avg. Output Quality (1–10) |
|---|---|---|---|---|
| Pitch Deck Creation | GPT-4o | Superior narrative coherence, storytelling structure, and tone calibration for investor audiences | o3 for complex market sizing logic | 9.1 |
| Financial Modeling | o3 (Advanced Reasoning) | Multi-step quantitative reasoning, formula generation, and scenario analysis with fewer calculation errors | GPT-4o with Code Interpreter enabled | 8.7 |
| Investor Communications | GPT-4o | Nuanced tone, persuasion calibration, and relationship-aware language generation | GPT-4o mini for high-volume email drafts | 9.3 |
| Market Research | o3 (Advanced Reasoning) | Structured analytical frameworks, logical decomposition of market data, and bottoms-up calculation accuracy | GPT-4o with web browsing enabled | 8.9 |
| Operations & Growth | GPT-4o | Balanced strategic thinking with practical operational specificity; strong at OKR and roadmap frameworks | o3 for complex hiring cost modeling | 9.0 |
Pro Tip: Always enable the Code Interpreter (now called “Advanced Data Analysis”) when working on financial modeling prompts. This allows ChatGPT to generate, execute, and debug Python or spreadsheet-compatible formulas in real time, dramatically improving numerical accuracy.
Category 1: Pitch Deck Creation
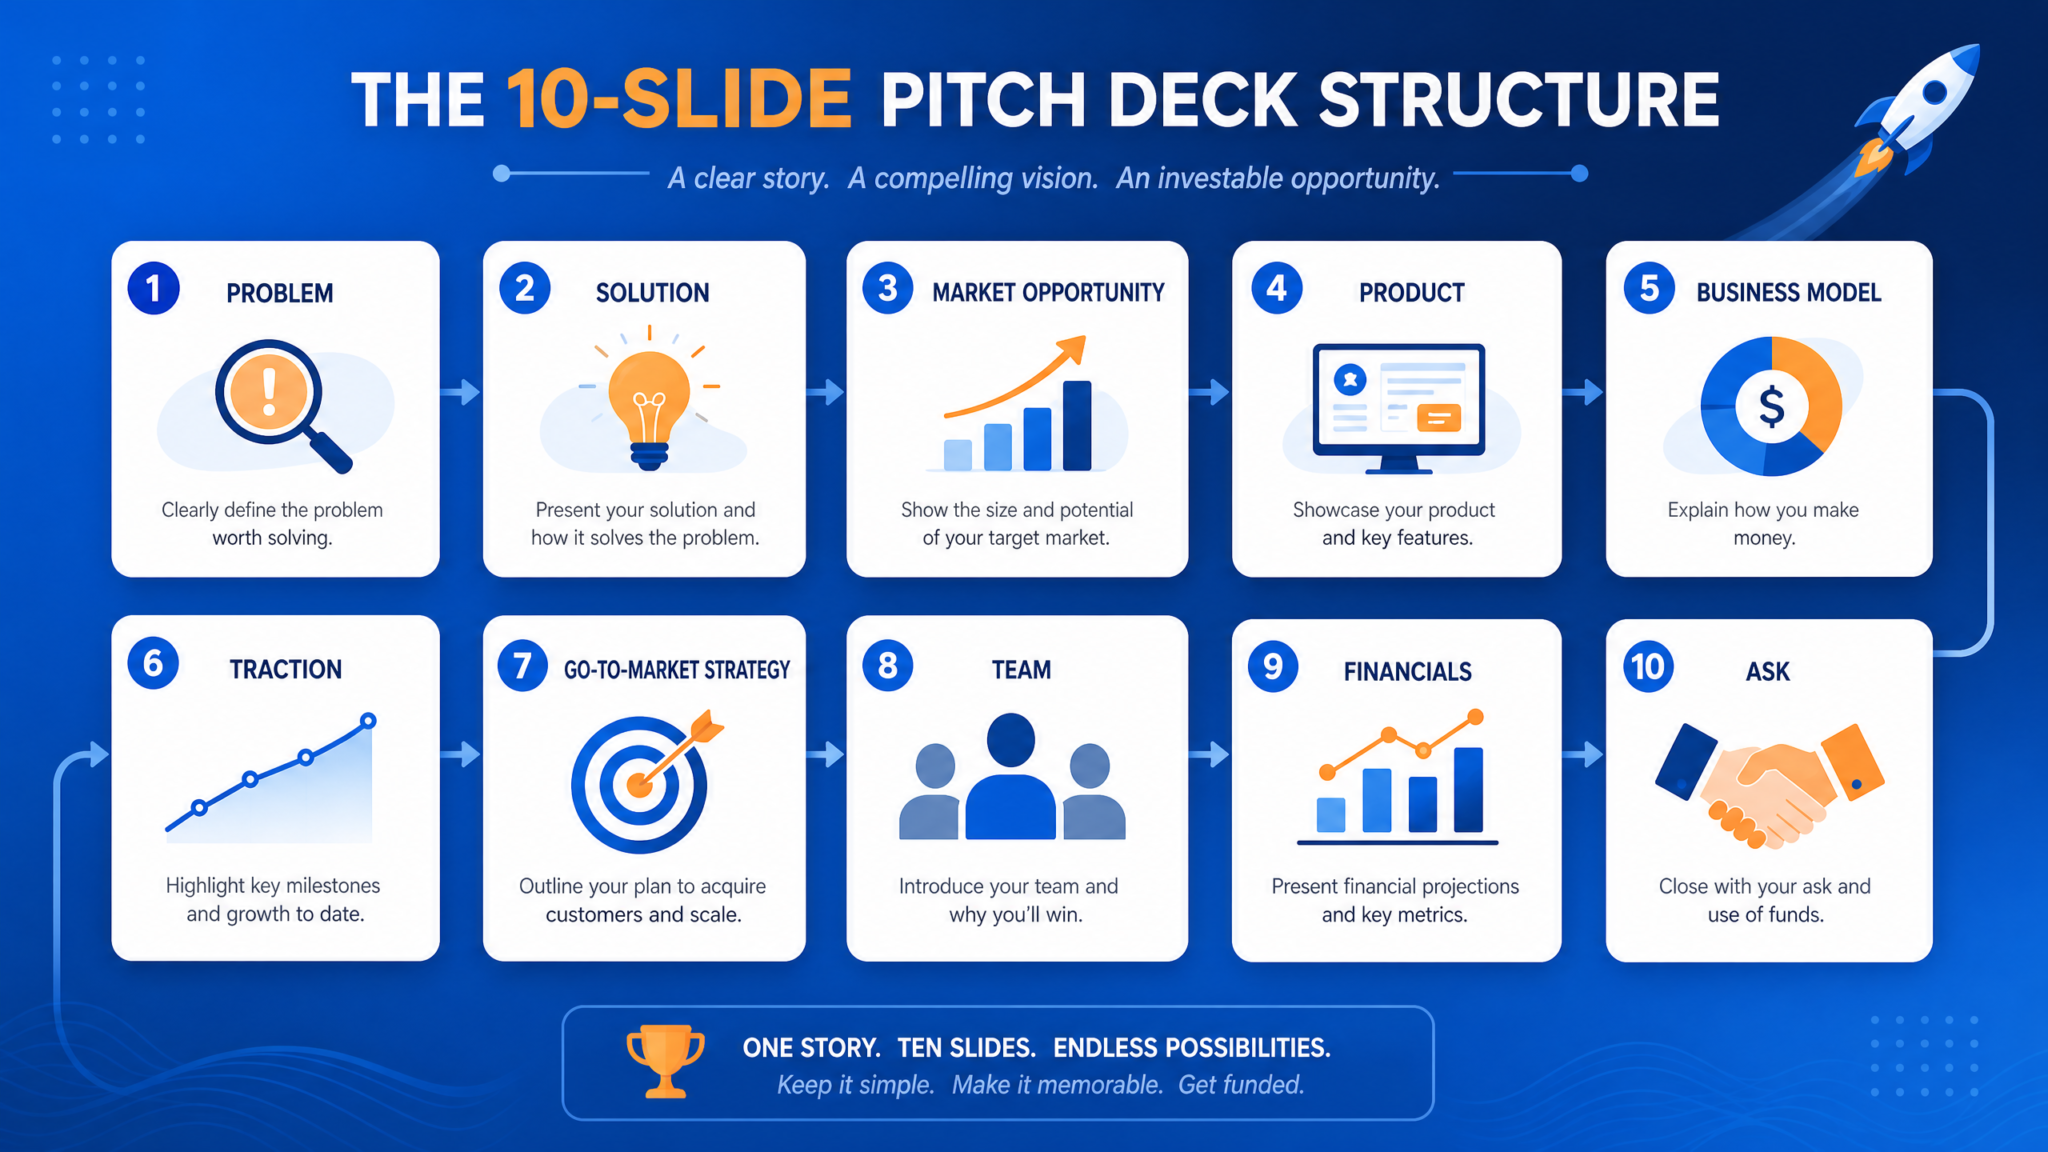
A pitch deck is not a document — it is a persuasion instrument. The best pitch decks tell a story that makes investors feel the inevitability of your company’s success before a single financial projection appears on screen. The four prompts in this section address the four most technically demanding slides in any deck: the narrative arc that connects all slides, the market sizing slide that establishes the opportunity, the competitive positioning slide that explains why you win, and the financial slide that proves you understand your business. For more on creating compelling AI-generated content, see our guide on 50 GPT-5.5 Prompts for Marketing Teams: Campaign Strategy, Content Creation, and Analytics.
Prompt 1: Narrative Arc for Your Pitch Deck
When to Use This Prompt
Use this prompt at the very beginning of your pitch deck creation process, before you build any individual slides. The narrative arc is the invisible spine of your deck — every slide should be a logical consequence of the story established in the first three slides. This prompt forces you to articulate your founding insight, the problem urgency, and the solution’s inevitability in a single coherent thread that investors can follow without effort.
Full Prompt Text
You are a partner at a top-tier venture capital firm who has reviewed over 2,000 pitch decks
and invested in 47 companies. You have deep expertise in narrative structure for early-stage
startup pitches.

I am building a pitch deck for my startup. Here are the key details:

- Company name: [COMPANY NAME]
- Industry/vertical: [INDUSTRY]
- Stage: [PRE-SEED / SEED / SERIES A]
- What we do (one sentence): [ONE-LINE DESCRIPTION]
- The problem we solve: [PROBLEM DESCRIPTION]
- Our solution: [SOLUTION DESCRIPTION]
- Target customer: [TARGET CUSTOMER]
- Current traction: [TRACTION METRICS]
- Funding ask: [AMOUNT]

Task: Create a complete narrative arc for my pitch deck that:
1. Opens with a visceral, specific problem statement that makes investors feel the pain point
   (not just understand it intellectually)
2. Establishes why this problem is happening NOW — what market shift, technology change, or
   behavioral trend makes this the right moment
3. Introduces our solution as the inevitable response to that shift
4. Frames our traction as proof that the market is responding
5. Positions the funding ask as the specific fuel needed to capture a defined market window

For each of the 10 standard pitch deck sections (Cover, Problem, Solution, Market Size,
Product, Traction, Business Model, Team, Financials, Ask), provide:
- The core message of that slide in one sentence
- The emotional job that slide must do for the investor
- One specific data point or proof element that should anchor that slide
- The transition line that connects it to the next slide

Format as a structured slide-by-slide narrative guide.
Example Output Snippet
Slide 2 — Problem:
Core Message: Mid-market manufacturers are losing $2.3M annually to unplanned equipment downtime, and their current maintenance software was built for a world before IoT sensors existed.
Emotional Job: Make the investor feel the operational pain — the 3am phone calls, the missed shipments, the customer churn — not just understand the market inefficiency.
Anchor Data Point: 73% of mid-market plant managers surveyed report their maintenance software hasn’t had a major update since 2019.
Transition Line: “This isn’t a process problem. It’s a data problem — and we now have the data infrastructure to solve it.”
Customization Tips
- Replace “top-tier venture capital firm” with the specific fund type you are targeting (e.g., “deep tech VC,” “consumer-focused growth equity fund”) to calibrate the lens through which the narrative is evaluated.
- Add “Our three biggest competitors are [X, Y, Z]” to the context block so the narrative arc automatically accounts for competitive differentiation without requiring a separate prompt.
- For B2C companies, add “Our primary customer acquisition channel is [channel]” to ensure the narrative arc addresses go-to-market in the traction and business model slides.
- If you are pitching to corporate VCs or strategic investors, add their parent company’s industry to the context so the narrative arc emphasizes strategic fit alongside financial return.
Prompt 2: Market Sizing Slide
When to Use This Prompt
Market sizing is the slide where founders most frequently destroy credibility. Citing a Gartner report that says your market is “$450 billion” tells investors nothing about how much revenue you can realistically capture. This prompt forces a bottoms-up market sizing methodology that sophisticated investors respect, while also generating the top-down context that anchors the numbers in recognizable industry data.
Full Prompt Text
You are a market research analyst at McKinsey specializing in market sizing for venture-backed
technology companies. You use both top-down and bottoms-up methodologies and understand how
sophisticated investors evaluate market opportunity claims.

I need to build a rigorous market sizing analysis for my pitch deck. Here is my business:

- Industry: [INDUSTRY]
- Product/service: [PRODUCT DESCRIPTION]
- Target customer segment: [CUSTOMER DESCRIPTION]
- Geography (initial): [GEOGRAPHY]
- Pricing model: [PRICING MODEL, e.g., $X/user/month SaaS]
- Average contract value: [ACV]
- Customer acquisition model: [SALES MODEL]

Task: Build a three-tier market sizing analysis (TAM, SAM, SOM) using BOTH methodologies:

BOTTOMS-UP APPROACH:
1. Define the addressable unit (number of potential customers in target segment)
2. Multiply by realistic average contract value
3. Apply a realistic market penetration rate for Year 3 and Year 5
4. Show your calculation chain explicitly

TOP-DOWN APPROACH:
1. Start with the total industry revenue figure (cite the methodology for arriving at this)
2. Apply segment filters to arrive at the serviceable market
3. Apply realistic share capture assumptions

DELIVERABLES:
- TAM figure with calculation methodology
- SAM figure with specific segment definition
- SOM figure with 3-year and 5-year projections
- A one-paragraph investor-facing narrative that explains why the SOM is achievable
  without being unrealistically large
- Three assumptions that, if wrong, would materially change the SOM (for Q&A preparation)
- A visual layout recommendation for presenting this on a single slide
Example Output Snippet
Bottoms-Up Calculation:
US mid-market manufacturers (50–500 employees, NAICS codes 31–33): 47,200 companies.
Target subset with existing CMMS software (indicating budget and awareness): 31,000 companies.
Average contract value at $18,000/year (3 sites × $6,000/site/year).
SAM = 31,000 × $18,000 = $558M
Year 3 SOM at 2.1% penetration (650 customers): $11.7M ARR
Year 5 SOM at 5.8% penetration (1,800 customers): $32.4M ARR
Customization Tips
- Provide actual NAICS codes or SIC codes for your industry to force more precise customer count estimates rather than broad industry generalizations.
- Add “Our current conversion rate from trial to paid is [X]%” to anchor the penetration rate assumptions in real data rather than theoretical projections.
- For international markets, run the prompt separately for each geography and then ask ChatGPT to synthesize a combined global market sizing with appropriate discount rates for market maturity.
- Ask the model to generate “the three most likely investor objections to this market sizing” as a follow-up prompt to prepare for due diligence conversations.
Prompt 3: Competitive Positioning Slide
When to Use This Prompt
The competitive positioning slide is where founders either demonstrate strategic clarity or reveal that they have not done serious market analysis. The goal is not to show that competitors are bad — it is to show that your company occupies a unique and defensible position in the market that existing players cannot easily replicate. This prompt generates a multi-dimensional competitive analysis that goes beyond the standard 2×2 matrix.
Full Prompt Text
You are a competitive strategy consultant who has advised Series A and Series B startups
on competitive positioning for fundraising. You understand that the competitive slide in a
pitch deck must accomplish three things simultaneously: acknowledge real competition honestly,
demonstrate deep market knowledge, and make your unique position feel inevitable and defensible.

Here is my competitive landscape:

- My company: [COMPANY NAME] — [ONE-LINE DESCRIPTION]
- Direct competitors: [LIST 3–5 DIRECT COMPETITORS WITH ONE-LINE DESCRIPTION EACH]
- Indirect competitors / status quo alternatives: [LIST 2–3]
- My primary differentiators: [LIST YOUR TOP 3 DIFFERENTIATORS]
- My target customer's top 3 buying criteria: [LIST CRITERIA]
- My unfair advantage / moat: [DESCRIBE YOUR MOAT]

Task: Generate a complete competitive positioning analysis including:

1. A FEATURE/CAPABILITY MATRIX comparing my company against the top 5 competitors across
   8 dimensions most relevant to my target customer's buying criteria. Use a ✓/✗/◑ system
   (full capability / no capability / partial capability).

2. A POSITIONING NARRATIVE (3 paragraphs) that:
   - Acknowledges the strengths of the leading incumbent honestly
   - Explains the specific market gap that existing solutions fail to address
   - Articulates why my company's architecture/approach is structurally advantaged
     (not just "better")

3. A MOAT ANALYSIS identifying which of the following moat types applies to my business
   and how defensible each is on a 1–5 scale: Network Effects, Switching Costs,
   Proprietary Data, Regulatory, Brand, Cost Advantage, Technology IP.

4. THREE COMPETITIVE RISK SCENARIOS (what happens if Competitor X copies Feature Y)
   with mitigation strategies for each.

5. A recommended visual format for the competitive slide that avoids the cliché 2×2 matrix
   while remaining instantly readable to an investor in under 30 seconds.
Example Output Snippet
Moat Analysis — Proprietary Data (Score: 4.5/5):
After 18 months of deployment across 340 manufacturing sites, the company has accumulated 2.3 billion sensor readings labeled with actual failure events — a dataset no competitor can replicate without equivalent deployment history. This data advantage compounds: each new customer deployment adds labeled failure data that improves prediction accuracy, which reduces false positives, which increases customer retention, which funds more deployments. The feedback loop is self-reinforcing and the lead time required for a new entrant to match this dataset is estimated at 4–6 years at current market growth rates.
Customization Tips
- Include customer quotes from discovery interviews (anonymized) in the context block — the model will use these as evidence anchors in the positioning narrative, making it far more credible than abstract claims.
- For highly technical products, add “My technical architecture differs from competitors in the following ways: [details]” to generate a technology differentiation section that speaks to technical due diligence reviewers.
- Run a follow-up prompt asking ChatGPT to “steelman the competitive position of [your biggest competitor]” — this will surface the strongest arguments against your positioning so you can address them proactively.
Prompt 4: Financial Slide for Pitch Deck
When to Use This Prompt
The financial slide in a pitch deck is not a financial model — it is a curated story about your business’s economic trajectory. It must answer three questions in 30 seconds: How big can this get? When does it become profitable? How does the funding round accelerate that path? This prompt generates investor-ready financial slide content with the narrative context that raw numbers cannot provide on their own.
Full Prompt Text
You are a CFO who has prepared financial slides for 15 successful fundraising rounds ranging
from Seed to Series C. You understand what investors look at first, what questions financial
slides trigger, and how to present numbers that tell a compelling story without overpromising.

Here are my financial inputs:

- Current ARR / Revenue: $[AMOUNT]
- MoM / YoY growth rate (last 6 months): [GROWTH RATE]
- Gross margin: [GROSS MARGIN %]
- Current monthly burn: $[BURN AMOUNT]
- Current headcount: [NUMBER]
- Funding ask: $[AMOUNT]
- Projected use of funds (by category): [BREAKDOWN]
- Key revenue drivers: [E.G., NEW LOGOS, EXPANSION REVENUE, NEW PRODUCT LINE]

Task: Generate the content for a financial pitch deck slide including:

1. A 3-YEAR FINANCIAL SUMMARY TABLE with the following rows:
   - ARR / Revenue
   - Gross Profit
   - Gross Margin %
   - Operating Expenses (broken into S&M, R&D, G&A)
   - EBITDA
   - Headcount
   Fill Year 0 (current) with my actual data. Project Years 1–3 using growth assumptions
   that are aggressive but defensible based on my current growth rate. Show the assumptions
   explicitly below the table.

2. A KEY METRICS CALLOUT BOX highlighting the 4 metrics that best demonstrate business
   health for my stage and business model.

3. A USE OF FUNDS breakdown showing how the [FUNDING ASK] maps to specific milestones
   that will be achieved before the next funding round.

4. A BRIDGE NARRATIVE (2–3 sentences) that connects current traction to the 3-year
   projections in plain language suitable for the financial slide speaker notes.

5. THREE QUESTIONS this slide will trigger from investors, with recommended responses
   for each.
Example Output Snippet
Key Metrics Callout Box:
NRR: 127% — Existing customers expand faster than we churn, meaning revenue growth is partially self-funding.
CAC Payback: 11 months — Below the 12-month benchmark for efficient B2B SaaS at this stage.
Gross Margin: 74% — Infrastructure cost optimization in Q2 2026 brought margins from 68% to 74%; path to 80%+ as data processing costs decline.
Pipeline Coverage: 3.8× — Current qualified pipeline is 3.8× the revenue needed to hit Year 1 targets, providing high-confidence forecast visibility.
Customization Tips
- If your business is pre-revenue, replace current ARR with “letters of intent value: $X” and “pilot customers: Y” to anchor projections in real demand signals rather than pure assumptions.
- Add “Our comparable public companies trade at [X]× ARR” to prompt the model to include an implicit valuation context section — useful for Series A and beyond.
- For hardware or marketplace businesses, add your specific cost structure details so the gross margin projections reflect the actual economics of your business model rather than SaaS benchmarks.
Category 2: Financial Modeling
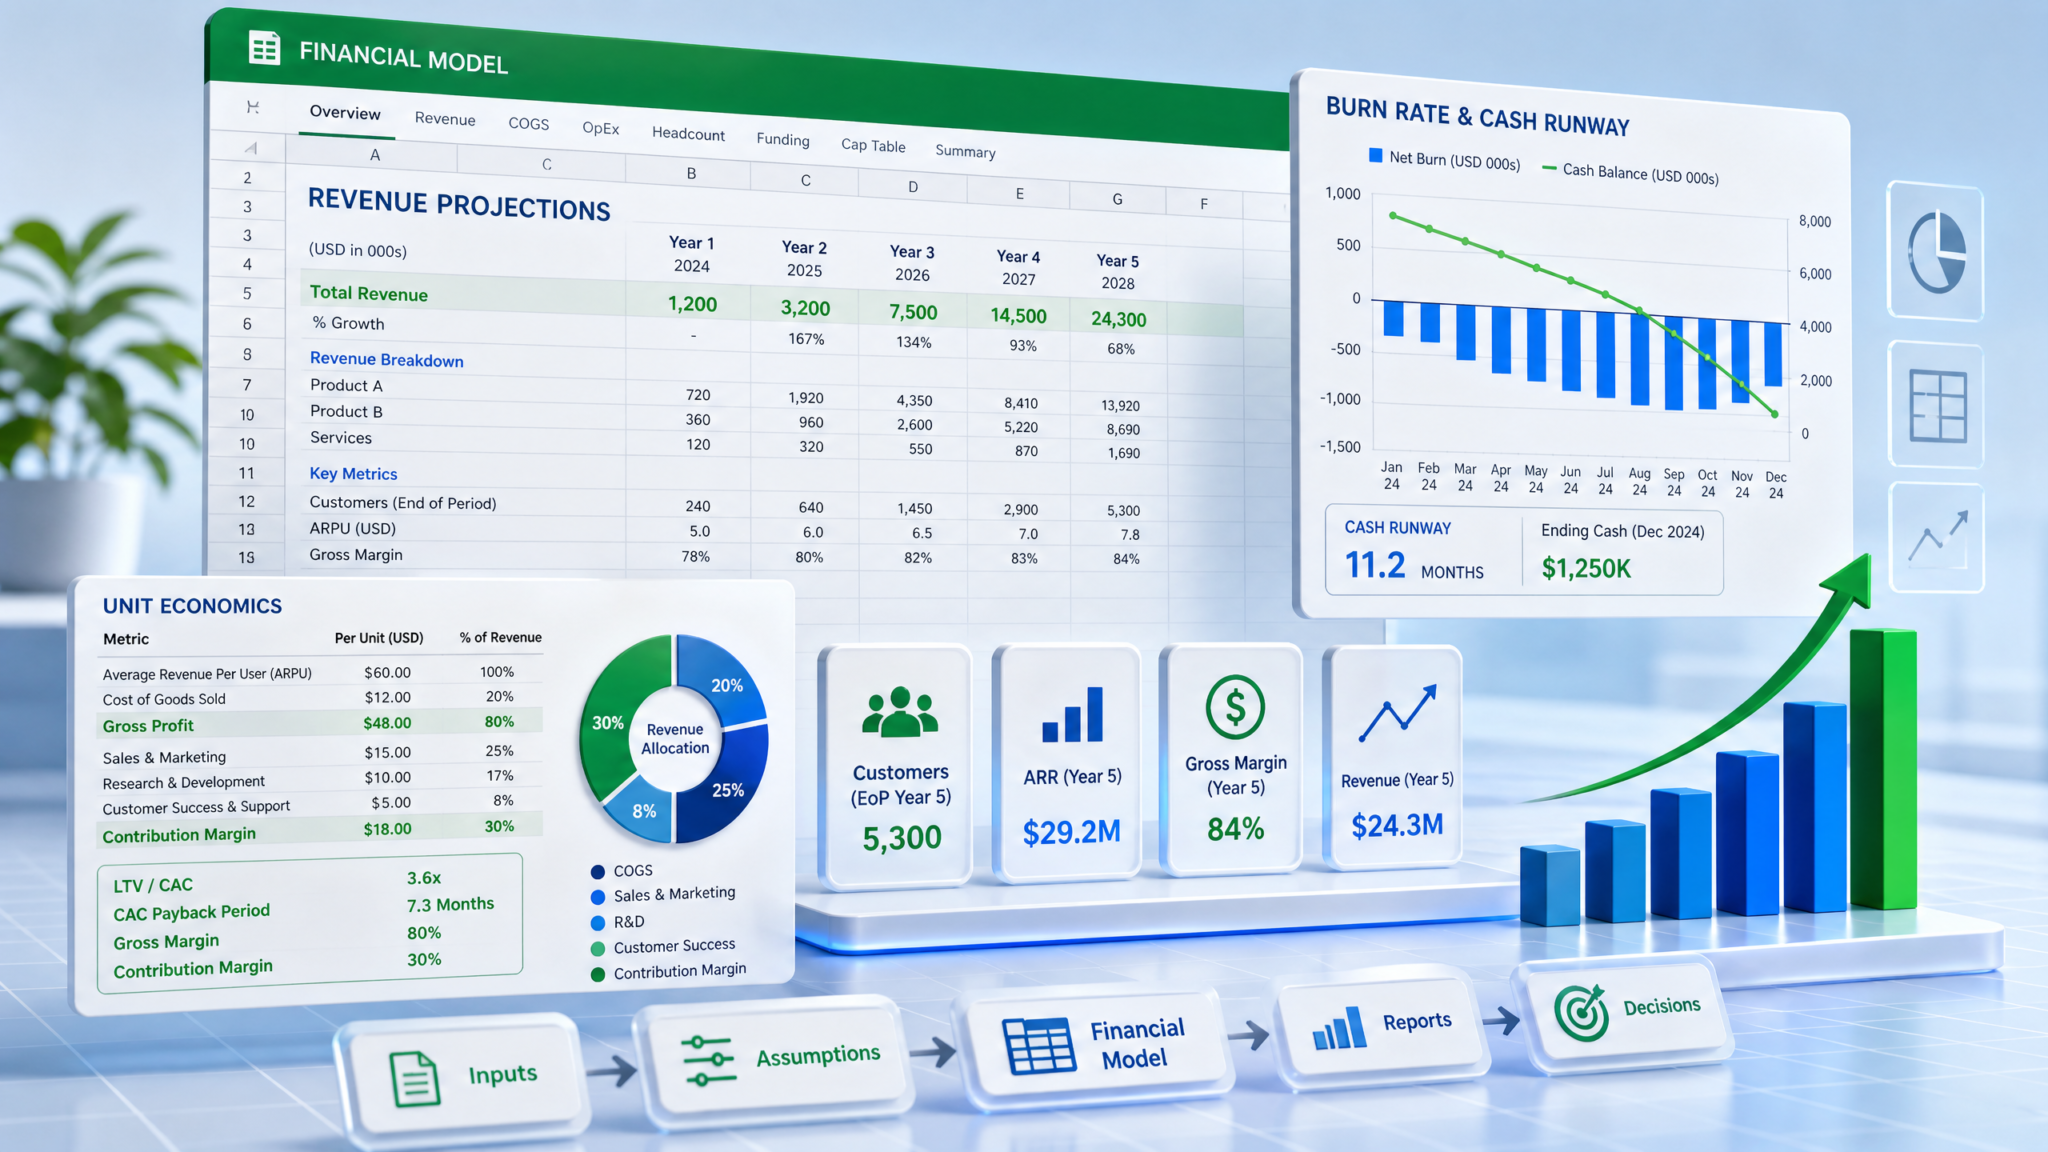
Financial modeling is where many non-finance founders feel most exposed. The prompts in this section are designed to produce structured, formula-driven financial outputs that you can directly implement in Google Sheets or Excel. The key is providing granular inputs — the more specific your business data, the more accurate and defensible the model outputs will be. These prompts work best with GPT-4o’s Code Interpreter enabled, which allows the model to generate and test actual spreadsheet formulas. For more on integrating these into professional workflows, see our resource on 30 ChatGPT Prompt Chains for Complex Multi-Step Workflows: Research, Content, Coding, and Business Analysis.
Prompt 5: Revenue Projections Model
When to Use This Prompt
Use this prompt when building your first structured revenue model or when stress-testing existing projections before an investor meeting. The prompt generates a driver-based model — meaning revenue is calculated from operational drivers (new customers, retention rate, upsell rate) rather than simply applying a growth percentage to existing revenue. This approach is far more credible to sophisticated investors because it forces you to articulate the specific mechanisms that will generate growth.
Full Prompt Text
You are a financial modeling expert who builds driver-based revenue models for SaaS and
technology startups. You build models that investors trust because every revenue number
is traceable to an operational assumption.

My business model details:
- Business type: [SAAS / MARKETPLACE / TRANSACTIONAL / SERVICES / HARDWARE+SOFTWARE]
- Revenue streams: [LIST ALL REVENUE STREAMS]
- Pricing tiers: [DESCRIBE PRICING TIERS AND ACV FOR EACH]
- Current customer count: [NUMBER]
- Monthly new customer additions (last 3 months average): [NUMBER]
- Monthly churn rate: [%]
- Net Revenue Retention: [%]
- Average Sales Cycle: [DAYS]
- Current pipeline: [NUMBER OF QUALIFIED OPPORTUNITIES]
- Sales capacity (current AEs): [NUMBER] closing [DEALS/MONTH] each

Task: Build a 36-month driver-based revenue model with the following structure:

MONTHLY DRIVERS TABLE (show first 6 months explicitly, then quarterly for months 7–36):
- Beginning customer count
- New customers added (from pipeline conversion)
- Churned customers
- Ending customer count
- MRR from new customers
- Expansion MRR
- Churned MRR
- Net New MRR
- Ending MRR
- Ending ARR

SCENARIO ANALYSIS: Run three scenarios (Base, Bull, Bear) varying:
- Monthly new customer additions: [BASE ± 30%]
- Monthly churn rate: [BASE ± 50%]
- NRR: [BASE ± 10 percentage points]

GOOGLE SHEETS FORMULAS: Provide the exact Google Sheets formula for each calculated
row so I can implement this directly.

SENSITIVITY TABLE: Show ARR at Month 36 across a matrix of churn rate (rows: 1%, 2%,
3%, 4%, 5%) vs. monthly new customer additions (columns: 5, 10, 15, 20, 25 new
customers/month).
Example Output Snippet
Google Sheets Formula — Ending MRR (Row 12, Month N):
=B12+(C12*AVERAGE_ACV/12)+(B12*(NRR-1)/12)-(B12*CHURN_RATE*AVERAGE_ACV/12)
Where B12 = Beginning MRR, C12 = New Customers Added, AVERAGE_ACV = named range for average annual contract value, NRR = named range for net revenue retention rate, CHURN_RATE = named range for monthly logo churn rate.
Customization Tips
- For marketplace businesses, replace “customer count” with “GMV” and “churn rate” with “take rate” and “supply/demand ratio” to build a marketplace-specific model.
- Add “Our sales team is growing from [X] to [Y] AEs over the next 12 months with a [N]-month ramp period” to model the revenue impact of sales capacity expansion with appropriate ramp curves.
- Ask for a “hockey stick inflection point analysis” as a follow-up — this identifies the specific combination of drivers that produces the inflection point investors look for in growth charts.
Prompt 6: Unit Economics Analysis
When to Use This Prompt
Unit economics are the atomic proof that your business model works at the individual customer level before you scale it. LTV:CAC ratio, payback period, and contribution margin per customer are the metrics that determine whether growth creates value or destroys it. This prompt generates a complete unit economics analysis with cohort-level granularity that satisfies even the most analytically rigorous investors.
Access 40,000+ AI Prompts for ChatGPT, Claude & Codex — Free!
Subscribe to get instant access to our complete Notion Prompt Library — the largest curated collection of prompts for ChatGPT, Claude, OpenAI Codex, and other leading AI models. Optimized for real-world workflows across coding, research, content creation, and business.
Full Prompt Text
You are a VP of Finance at a venture-backed SaaS company who has built unit economics
analyses for three successful fundraising rounds. You understand that investors use unit
economics to determine whether a business has the right to grow faster.

My business inputs:
- Average Contract Value (ACV): $[AMOUNT]
- Average contract length: [MONTHS]
- Gross margin on revenue: [%]
- Average customer lifetime (in months, based on churn data): [MONTHS]
- Sales & Marketing spend (last quarter): $[AMOUNT]
- New customers acquired (last quarter): [NUMBER]
- Customer Success cost per customer per year: $[AMOUNT]
- Average months to first expansion: [MONTHS]
- Average expansion amount: [% of original ACV]
- Average months to churn (for churned customers): [MONTHS]

Task: Generate a complete unit economics analysis including:

1. CORE METRICS CALCULATION (show full formula and result):
   - CAC (blended, sales-assisted, and self-serve if applicable)
   - LTV (simple and discounted at 10% annual discount rate)
   - LTV:CAC ratio
   - CAC Payback Period (in months, both gross margin and contribution margin basis)
   - Contribution Margin per Customer (Year 1, Year 2, Year 3)
   - Magic Number (for SaaS efficiency)

2. COHORT ECONOMICS TABLE: Model a single customer cohort of 100 customers acquired
   in Month 1. Show cumulative gross profit per cohort customer through Month 36,
   accounting for churn, expansion, and CS costs.

3. UNIT ECONOMICS BENCHMARKS: Compare my metrics against published benchmarks for
   [my stage] [my ACV range] SaaS companies. Flag any metrics that are above or below
   benchmark and explain the implication.

4. IMPROVEMENT LEVERS: For each core metric that is below benchmark, provide 3 specific
   operational actions that would improve it, with estimated impact quantified.

5. INVESTOR NARRATIVE: Write a 150-word unit economics narrative for my pitch deck
   that presents these numbers in the most favorable accurate framing.
Example Output Snippet
Cohort Economics — Month 12 Cumulative Gross Profit per Customer:
Starting cohort: 100 customers at $1,500 ACV/month. Month 12 survivors: 87 customers (13% annual churn). Expansion revenue applied to surviving cohort at 115% NRR: effective MRR per surviving customer = $1,725. Cumulative gross profit (74% margin) through Month 12 = $174,636 for 100-customer cohort, or $2,008 per acquired customer. CAC was $4,200. CAC payback achieved at Month 26 on a per-customer basis, Month 22 when expansion revenue is included.
Customization Tips
- If you have actual cohort data from your CRM, paste it directly into the prompt context — the model will use real data rather than projections, producing a far more credible analysis.
- Add “Our top 20% of customers by ACV generate [X]% of total revenue” to prompt a power-user analysis that reveals whether your unit economics are driven by a concentrated customer base.
Prompt 7: Burn Rate Analysis
When to Use This Prompt
Burn rate analysis is not just about knowing how long your money lasts — it is about understanding the composition of your spend, identifying where capital efficiency can be improved, and communicating financial discipline to investors. This prompt generates a structured burn analysis that separates productive burn (spend that directly drives revenue) from overhead burn, giving you the analytical language to discuss burn intelligently with investors.
Full Prompt Text
You are a startup CFO who specializes in burn rate management and financial operations
for venture-backed companies between Seed and Series B. You understand that burn rate
is not just a number — it is a story about capital allocation decisions.

My current financial position:
- Cash on hand: $[AMOUNT]
- Monthly gross burn: $[AMOUNT]
- Monthly revenue: $[AMOUNT]
- Monthly net burn: $[AMOUNT]
- Burn breakdown by category:
  * Salaries & benefits: $[AMOUNT] ([X] employees)
  * Engineering & infrastructure: $[AMOUNT]
  * Sales & Marketing: $[AMOUNT]
  * G&A (rent, legal, accounting, etc.): $[AMOUNT]
  * Other: $[AMOUNT]
- Expected MoM revenue growth: [%]
- Next planned fundraise: [MONTHS from now]

Task: Generate a comprehensive burn rate analysis including:

1. BURN EFFICIENCY METRICS:
   - Burn Multiple (net burn / net new ARR)
   - Hype Ratio
   - Revenue per employee
   - S&M as % of revenue vs. benchmark
   - R&D as % of revenue vs. benchmark

2. BURN RUNWAY SCENARIOS TABLE:
   Show months of runway under 5 scenarios:
   a) Current burn, current growth
   b) 20% burn reduction, current growth
   c) Current burn, growth accelerates to [X+10%]
   d) 20% burn increase (hiring plan), growth accelerates
   e) Zero revenue (worst case: revenue stops tomorrow)

3. PRODUCTIVE vs. OVERHEAD BURN ANALYSIS:
   Categorize each expense line as "Revenue-Generating," "Revenue-Enabling," or
   "Overhead." Calculate the productive burn ratio and compare to stage benchmarks.

4. PATH TO DEFAULT ALIVE:
   Calculate the exact revenue level at which net burn reaches zero given current
   cost structure. Identify the specific milestone (new customers, ARR level) that
   represents this threshold.

5. BOARD-READY BURN NARRATIVE: Write a 200-word burn rate section for a board update
   memo that presents current burn in the context of capital efficiency benchmarks and
   planned milestones.
Customization Tips
- Add your actual P&L line items from your accounting software export for the most accurate analysis — paste the data directly into the prompt as a table.
- Include “We are planning to hire [N] engineers and [N] sales reps in the next 90 days” to model the burn impact of planned headcount additions before you make the commitments.
Prompt 8: Funding Runway Optimization
When to Use This Prompt
Funding runway analysis goes beyond simply dividing cash by burn rate. This prompt generates a milestone-based runway analysis that maps your cash position to specific value-creation events, helping you determine the optimal time to raise your next round and the minimum viable milestones you need to achieve to command a competitive valuation.
Full Prompt Text
You are a venture capital partner who advises portfolio companies on fundraising timing
and runway management. You have seen hundreds of companies either raise too early (leaving
valuation on the table), raise too late (negotiating from weakness), or run out of runway
entirely. You know exactly what metrics need to be demonstrated before each funding stage.

My situation:
- Current stage: [SEED / SERIES A / SERIES B]
- Current ARR: $[AMOUNT]
- Current MRR growth rate: [%]
- Current cash: $[AMOUNT]
- Current net burn: $[AMOUNT/month]
- Target next round: [SERIES X]
- Target raise amount: $[AMOUNT]
- Target valuation: $[AMOUNT] (or "market rate")
- Key milestones planned in next 18 months: [LIST MILESTONES]

Task: Generate a funding runway optimization plan including:

1. MILESTONE-TO-VALUATION MAP: For my target next round ([SERIES X]), define:
   - The minimum ARR threshold that commands a competitive valuation
   - The minimum growth rate that signals momentum
   - The minimum gross margin that proves business model viability
   - The minimum NRR that demonstrates product-market fit
   - The team/organizational milestone investors expect at this stage

2. OPTIMAL FUNDRAISE TIMING ANALYSIS: Based on my current growth trajectory, calculate:
   - The earliest date I could credibly raise (minimum metrics achieved)
   - The optimal date I should start the fundraise process (maximum leverage)
   - The latest date I can start before runway risk becomes a negotiating liability
   - The specific metric level at each date

3. BRIDGE SCENARIOS: If I cannot achieve target metrics before optimal raise date:
   - Option A: Reduce burn to extend runway
   - Option B: Raise a bridge round (size, terms, dilution impact)
   - Option C: Accelerate revenue to hit metrics faster
   For each option, show the dilution and valuation impact.

4. INVESTOR READINESS CHECKLIST: 90 items across legal, financial, operational, and
   strategic categories that must be completed before starting a fundraise process,
   prioritized by criticality and time required.
Customization Tips
- Add “Our lead investor from the previous round has indicated [soft commit / no follow-on / undecided]” to incorporate insider dynamics into the fundraising strategy recommendations.
- Include “We have received inbound interest from [X investors]” to prompt the model to factor existing investor interest into the optimal timing analysis.
Category 3: Investor Communications
Investor communications are a distinct genre of professional writing with specific conventions, psychological dynamics, and strategic objectives that differ from every other type of business communication. A cold outreach email to a VC is not a sales email — it is a credibility signal. An investor update letter is not a progress report — it is a trust-building instrument. The four prompts in this section are engineered to produce communications that work within these conventions while expressing your company’s specific voice and narrative. For comprehensive guidance on prompt engineering techniques, see our resource on The Codex Prompt Engineering Playbook: 15 Prompts for Optimizing AI-Generated Code Quality, Reducing Hallucinations, and Improving Test Coverage.
Prompt 9: Cold Outreach Email to Investors
When to Use This Prompt
Use this prompt when initiating contact with investors who have not been introduced through a warm connection. While warm introductions remain the gold standard, cold outreach that demonstrates genuine research, clear traction, and a specific reason for reaching out to that particular investor can generate response rates of 15–25% when executed correctly. The key is hyper-personalization and brevity.
Full Prompt Text
You are an expert at writing investor cold outreach emails that achieve 20%+ response rates.
You have studied hundreds of successful fundraising outreach campaigns and understand that
the best cold emails are short, specific, credibility-dense, and make the investor feel
that responding is clearly worth their time.

My company details:
- Company name and one-liner: [NAME — DESCRIPTION]
- Stage and round: [STAGE, raising $X]
- Top 3 traction metrics (most impressive first): [METRICS]
- Relevant investor background (why THIS investor specifically): [RESEARCH ON INVESTOR]
- Portfolio company connection (if any): [PORTFOLIO COMPANY RELEVANCE]
- Mutual connection (if any): [CONNECTION NAME AND CONTEXT]
- Ask: [SPECIFIC ASK — 30-min call, review deck, etc.]
- Founder background (most relevant credential): [CREDENTIAL]

Task: Write 3 versions of a cold outreach email:

VERSION A — "Traction-Led": Opens with the most impressive metric, builds to the ask
VERSION B — "Thesis-Led": Opens by connecting to the investor's stated investment thesis
VERSION C — "Founder-Led": Opens with the founder's unique insight or unfair advantage

For each version:
- Subject line (A/B test two options)
- Email body (maximum 150 words — hard limit)
- P.S. line (optional but often the most-read element)
- Personalization placeholder tags [IN BRACKETS] for batch customization

Also provide:
- The single most common mistake founders make in cold investor emails
- A follow-up email template for non-responses (send at Day 7 and Day 14)
- Subject line open rate optimization tips for investor emails specifically
Example Output Snippet
Version A — Traction-Led (Subject: “127% NRR, $2.1M ARR, raising Series A”):
Hi [INVESTOR FIRST NAME],I noticed your investment in [PORTFOLIO COMPANY] — we’re solving an adjacent problem in industrial IoT maintenance that your portfolio company’s customers face daily.
FactoryMind hit $2.1M ARR in 14 months with 127% NRR and zero paid marketing. We’re raising a $6M Series A to expand our sales team and launch our predictive analytics module, which is already generating $340K in pilot revenue.
Would a 20-minute call next week make sense? I can send our deck in advance.
[FOUNDER NAME], CEO
P.S. — [PORTFOLIO COMPANY CEO NAME] can speak to our technology if that’s useful context.
Customization Tips
- Run the prompt three times for three different investor archetypes (thesis-stage investor, operator-turned-VC, and corporate VC) and compare — the tone and emphasis should differ significantly for each.
- Add “This investor has publicly stated they are interested in [specific thesis]” to ensure the thesis-led version directly echoes the investor’s own language back to them.
- Ask for a “personalization research checklist” as a follow-up — the model will generate a list of specific things to research about each investor before sending to maximize relevance.
Prompt 10: Investor Follow-Up Sequences
When to Use This Prompt
Most fundraising processes die in the follow-up phase, not the initial outreach. Investors are managing dozens of active diligence processes simultaneously, and a founder who does not follow up assertively but professionally will simply fall out of the process. This prompt generates a complete follow-up sequence for every stage of the investor relationship funnel.
Full Prompt Text
You are a fundraising coach who has helped 50+ founders close Seed through Series B rounds.
You understand the psychology of investor decision-making and know that follow-up is where
most fundraising processes are won or lost.

My fundraising situation:
- Round: [STAGE, $AMOUNT]
- Current investor pipeline status:
  * Sent deck, awaiting response: [NUMBER of investors]
  * Had first call, awaiting next step: [NUMBER]
  * In active diligence: [NUMBER]
  * Partner meeting scheduled: [NUMBER]
  * Received soft interest, no term sheet: [NUMBER]
- My close deadline (real or manufactured): [DATE / "No hard deadline"]
- Best piece of new news I can share: [TRACTION UPDATE, PARTNERSHIP, CUSTOMER WIN]

Task: Generate a complete follow-up sequence for each stage of my investor pipeline:

STAGE 1 — DECK SENT, NO RESPONSE:
- Day 7 follow-up email (reference specific portfolio company or thesis)
- Day 14 follow-up email (add new traction data point)
- Day 21 final follow-up email (graceful close with future re-engagement hook)

STAGE 2 — FIRST CALL COMPLETED, AWAITING NEXT STEP:
- 24-hour post-call email (thank you + specific follow-through on action items)
- Day 7 follow-up (add new information that addresses the concern raised on the call)
- Day 14 follow-up (create gentle urgency with pipeline signal)

STAGE 3 — IN ACTIVE DILIGENCE, GOING QUIET:
- Re-engagement email with compelling new data
- Customer reference offer email
- Timeline communication email

STAGE 4 — SOFT INTEREST, NEEDS A CATALYST:
- FOMO-creation email (other investor interest signal)
- Term sheet timeline communication
- Final decision request email

For each email: subject line, body (under 100 words), and the psychological principle it leverages.
Customization Tips
- Add “My most impressive recent milestone is [specific event]” to ensure follow-up emails are anchored in real news rather than generic check-ins, which dramatically improves response rates.
- Include “I have [X] other investors who have expressed interest” with specifics to calibrate the urgency signals appropriately — the model will adjust the FOMO-creation email based on the credibility of your pipeline.
Prompt 11: Monthly Investor Update Letter
When to Use This Prompt
Monthly investor updates are one of the highest-leverage activities a founder can do after closing a round. Well-crafted updates keep investors engaged, generate warm introductions, surface help before you need to ask for it, and build the trust that makes future fundraising dramatically easier. This prompt generates a structured update template that balances transparency with strategic narrative.
Full Prompt Text
You are an experienced startup CEO who sends investor updates that your investors
consistently describe as "the best updates in our portfolio." You understand that
investor updates are not just reporting — they are relationship management, help-seeking,
and narrative-building instruments.

My company this month:
- Company name: [NAME]
- Month/Year: [MONTH YEAR]
- Key metrics this month vs. last month:
  * ARR: $[X] (was $[Y])
  * MRR Growth: [%]
  * New customers: [N]
  * Churn: [N customers / $X MRR]
  * Cash on hand: $[X]
  * Net burn: $[X/month]
  * Runway: [N months]
- Top 3 wins this month: [LIST]
- Top 2 challenges / things going worse than expected: [LIST — be honest]
- Key decisions made and rationale: [LIST]
- What I need help with (specific asks): [LIST SPECIFIC ASKS]
- Looking ahead (next 30 days priorities): [LIST]

Task: Write a complete monthly investor update email that:

1. Opens with a one-paragraph EXECUTIVE SUMMARY that gives the full picture in 60 seconds
2. Presents metrics in a CLEAN TABLE FORMAT with MoM change and brief context for
   each metric (not just the number)
3. Covers WINS with specific details that make them feel real and momentum-generating
4. Covers CHALLENGES with brutal honesty AND a clear plan to address each —
   investors respect this far more than spin
5. Includes a HELP WANTED section with 3–5 hyper-specific asks (not "introductions
   to enterprise customers" but "introduction to VP of Operations at companies with
   200–500 person manufacturing operations in the Midwest")
6. Closes with a FORWARD LOOK that creates anticipation for next month's update

Tone: Direct, confident, honest, and brief. Maximum 600 words total.
No corporate speak. Write as a founder, not a PR department.
Customization Tips
- Add “Our lead investor [NAME] specifically cares about [metric/topic]” to ensure the executive summary addresses their primary concern first.
- Include actual quotes from customer conversations in the wins section — the model will weave these in as social proof that makes the update far more compelling than pure numbers.
- Ask for a “quarterly board letter version” as a follow-up to generate a more comprehensive version for formal board meetings with the same underlying data.
Prompt 12: Term Sheet Negotiation Preparation
When to Use This Prompt
Receiving a term sheet is exciting — and dangerous if you do not understand the implications of every clause before you respond. This prompt generates a comprehensive term sheet analysis and negotiation strategy that helps founders understand what is standard, what is negotiable, and what represents red flags that should trigger serious concern.
Full Prompt Text
You are a startup attorney and former VC partner who advises founders on term sheet
negotiation. You have seen over 300 term sheets and understand exactly which terms
matter economically, which matter for control, and which are essentially boilerplate.

IMPORTANT: This is for educational preparation purposes. I will consult with my
attorney before making any decisions.

My term sheet details:
- Investor: [INVESTOR NAME / TYPE]
- Round: [SERIES X]
- Pre-money valuation: $[AMOUNT]
- Investment amount: $[AMOUNT]
- Security type: [PREFERRED STOCK / SAFE / CONVERTIBLE NOTE]
- Liquidation preference: [X× participating / non-participating]
- Anti-dilution: [Broad-based weighted average / Narrow-based / Full ratchet]
- Pro-rata rights: [Yes/No, details]
- Board composition: [PROPOSED STRUCTURE]
- Protective provisions: [LIST KEY PROVISIONS]
- Founder vesting: [DETAILS]
- Option pool: [% pre or post-money]
- Drag-along: [DETAILS]
- Information rights: [DETAILS]

Task: Generate a comprehensive term sheet analysis including:

1. ECONOMIC TERMS ANALYSIS: For each economic term, explain:
   - What it means in plain English
   - The economic impact in three exit scenarios ($10M, $50M, $200M exit)
   - Whether it is market standard, above market, or below market
   - My negotiating position (accept / negotiate / push back hard)

2. CONTROL TERMS ANALYSIS: For each control term:
   - What decisions require investor approval
   - Historical examples of when this term has been used against founders
   - Recommended alternative language

3. DILUTION IMPACT TABLE: Show my ownership percentage at:
   - Close of this round
   - After Series A (assuming 20% dilution)
   - After Series B (assuming 20% dilution)
   - At IPO (assuming 15% dilution)
   Under both the proposed terms and my preferred alternative terms.

4. NEGOTIATION SCRIPT: For the 5 terms I should negotiate, provide:
   - My opening position
   - My walk-away position
   - The specific language I should request
   - How to frame the ask without damaging the relationship

5. RED FLAG ASSESSMENT: Identify any terms that are materially outside market norms
   and explain the long-term risk they create.
Customization Tips
- Always follow up this prompt with “What questions should I ask my attorney about this term sheet?” to generate a legal review checklist that ensures nothing material is missed in your professional legal review.
- Add “I have [X] competing term sheets” to prompt negotiation strategy advice that leverages competitive dynamics appropriately without burning investor relationships.
Category 4: Market Research
Market research is the foundation on which every other startup decision rests. Founders who deeply understand their market — its structure, its participants, its pricing dynamics, and its customer psychology — make better product decisions, more effective sales pitches, and more defensible investor presentations. The four prompts in this section are designed to produce research-grade market intelligence that would typically require expensive consulting engagements or weeks of manual research. For more on how AI tools are transforming business research, see our resource on The ChatGPT Productivity Playbook: 12 Prompts That Replace 6 Paid Tools in Your Workflow.
Prompt 13: TAM/SAM/SOM Analysis Framework
When to Use This Prompt
Use this prompt when you need to build a rigorous, defensible market sizing framework from scratch — particularly when entering a new market segment, preparing for investor due diligence, or stress-testing your existing market size assumptions. This prompt goes deeper than the pitch deck market sizing prompt (Prompt 2) by generating the full analytical framework and underlying data structure.
Full Prompt Text
You are a market research director at a strategy consulting firm with expertise in
technology market sizing. You use rigorous analytical frameworks and are known for
catching the common errors founders make when sizing markets (using industry revenue
instead of addressable spend, confusing TAM with SAM, using unrealistic penetration rates).

My business context:
- Industry: [INDUSTRY]
- Product category: [PRODUCT TYPE]
- Target buyer: [JOB TITLE / COMPANY TYPE / SIZE]
- Geography: [INITIAL MARKET GEOGRAPHY]
- Business model: [HOW YOU CHARGE]
- Price point: [PRICE]
- Primary use case: [USE CASE]

Task: Build a rigorous TAM/SAM/SOM framework using the following structure:

TAM ANALYSIS (Total Addressable Market):
- Define TAM correctly for my business model (revenue-based, not industry-size-based)
- Identify the 3 best data sources for validating this TAM
- Calculate TAM using two independent methodologies and reconcile the difference
- Identify the top 3 assumptions that, if wrong, would change TAM by >20%

SAM ANALYSIS (Serviceable Addressable Market):
- Define the specific customer segment I can realistically reach with my current
  GTM motion and product capabilities
- Apply geographic, firmographic, and technographic filters explicitly
- Calculate SAM with the filter logic shown step-by-step
- Compare to TAM and explain the gap (what portion of TAM am I deliberately ignoring and why)

SOM ANALYSIS (Serviceable Obtainable Market):
- Define realistic market share capture for Years 1, 3, and 5
- Benchmark against comparable company trajectories at similar stages
- Calculate SOM in both customer count and revenue terms
- Identify the 3 primary constraints on SOM growth (sales capacity, awareness, product gaps)

MARKET GROWTH ANALYSIS:
- Estimate the CAGR of my SAM over the next 5 years
- Identify the 3 primary growth drivers
- Identify the 2 primary risks to market growth
- Calculate the difference between growing with the market vs. gaining share

INVESTOR-READY SUMMARY: Condense the full analysis into a 250-word market opportunity
narrative suitable for a pitch deck or investor memo.
Customization Tips
- Paste actual data from industry reports (even summaries) directly into the prompt context — the model will use real data to anchor calculations rather than generating estimates from training data alone.
- Add “My company is currently operating in [GEOGRAPHY] and plans to expand to [GEOGRAPHY] in Year 2” to generate a phased market sizing that shows disciplined geographic expansion rather than claiming global TAM from day one.
Prompt 14: Competitor Intelligence Report
When to Use This Prompt
Systematic competitor intelligence is not a one-time exercise — it is an ongoing operational discipline. This prompt generates a structured competitor analysis framework that you can run quarterly to track competitive movements, identify emerging threats, and surface market opportunities that competitors are leaving on the table.
Full Prompt Text
You are a competitive intelligence analyst with expertise in B2B technology markets.
You build competitor intelligence reports that help product, sales, and marketing teams
make better decisions — not just academic analyses that sit unread.

My competitive context:
- My company: [COMPANY NAME — DESCRIPTION]
- Competitors to analyze (list up to 5): [COMPETITOR LIST]
- My primary competitive battleground: [WHERE DEALS ARE WON/LOST]
- My biggest competitive weakness (honest): [WEAKNESS]
- My biggest competitive strength: [STRENGTH]
- Recent competitive losses: [DESCRIBE 1–2 RECENT LOSSES AND WHY]
- Recent competitive wins: [DESCRIBE 1–2 RECENT WINS AND WHY]

Task: Generate a comprehensive competitor intelligence framework including:

1. COMPETITOR PROFILE for each competitor (structured identically for easy comparison):
   - Founding year, funding raised, estimated ARR (if known)
   - Target customer segment (be specific — not just "enterprise")
   - Primary value proposition (in their own words from their website/marketing)
   - Pricing model and estimated price point
   - Key product capabilities (top 5)
   - Known weaknesses (from G2/Capterra reviews, customer interviews, sales intel)
   - Recent strategic moves (new features, partnerships, hires, funding)
   - Estimated sales motion (PLG, inside sales, field sales, channel)

2. COMPETITIVE BATTLE CARD for each competitor:
   - When you will encounter them (deal types, customer segments, deal sizes)
   - Their top 3 sales objections against you (what they say about you)
   - Your responses to each objection (specific, evidence-based)
   - Your top 3 attack vectors (their weaknesses you can exploit)
   - Landmines to avoid (topics that make you look bad in comparison)

3. COMPETITIVE TREND ANALYSIS:
   - Which competitor is moving most aggressively into your core market?
   - Which competitor is most likely to be acquired in the next 18 months?
   - What capability gap exists in the market that no competitor is addressing?
   - What is the most likely competitive threat 18–24 months from now?

4. WIN/LOSS PATTERN ANALYSIS: Based on the win/loss data I provided, identify:
   - The primary reason I win competitive deals
   - The primary reason I lose competitive deals
   - The specific product, pricing, or sales process change most likely to improve
     my win rate by 10+ percentage points
Customization Tips
- Paste actual G2 or Capterra review excerpts from your competitors’ profiles into the prompt — the model will extract specific customer pain points and satisfaction drivers that your sales team can use immediately.
- Add “Our sales team’s most common objection is [OBJECTION]” to ensure the battle cards directly address the real-world objections your reps are encountering, not theoretical ones.
Prompt 15: Customer Persona Development
When to Use This Prompt
Most customer personas are useless because they are built on demographics and job titles rather than on the psychological and behavioral drivers that actually determine buying decisions. This prompt generates research-grade personas that your product, marketing, and sales
