
In today’s fast-paced business environment, enterprise data analysis has become essential for strategic decision-making. With the advent of powerful AI models like GPT-5.5, business teams can now automate complex data workflows, generate insightful reports, and detect anomalies with unprecedented accuracy and efficiency. This comprehensive tutorial, authored by Markos Symeonides, walks you through leveraging GPT-5.5 for enterprise data analysis—covering spreadsheet automation, variance analysis, Close reporting, and dashboard insights.

Introduction to GPT-5.5 in Enterprise Data Analysis
GPT-5.5 is the latest iteration of OpenAI’s generative pre-trained transformers, optimized for enhanced understanding and generation of structured and unstructured data. Unlike previous versions, GPT-5.5 excels in handling tabular data, complex queries, natural language generation (NLG), and anomaly detection within large enterprise datasets.
The model introduces significant architectural improvements including:
- Expanded Context Window: GPT-5.5 supports up to 64k tokens, enabling it to process vast datasets or entire reports in a single interaction.
- Multimodal Capabilities: Beyond text, GPT-5.5 can interpret and generate analyses based on images, charts, and PDFs, which is crucial for comprehensive enterprise data interpretation.
- Improved Reasoning and Math Skills: Enhanced fine-tuning has resulted in superior handling of numerical data, formula generation, and complex calculations, making it suited for finance and operations teams.
This tutorial assumes a foundational understanding of data analysis concepts and familiarity with business intelligence tools. We will cover practical applications and provide code snippets and prompt engineering strategies tailored for business and finance analysts.
Why Use GPT-5.5 for Enterprise Data Analysis?
- Advanced Natural Language Understanding: GPT-5.5 can interpret complex business queries phrased in natural language and translate them into actionable data operations.
- Spreadsheet Automation: Automate repetitive tasks such as formula generation, data cleaning, and report formatting.
- Variance and Anomaly Detection: Quickly identify discrepancies in financial data or operational metrics.
- Close Reporting: Generate narrative summaries and explanations of financial close processes.
- Dashboard Insights: Enhance dashboards with AI-generated insights and contextual analysis.
- Multimodal Data Input: Incorporate charts, images, and even PDFs to enrich analysis beyond raw numbers.
- Scalable Integration: Easily embed GPT-5.5 capabilities into existing enterprise systems via APIs and SDKs.
Setting Up GPT-5.5 for Enterprise Use
Accessing GPT-5.5 API
To start integrating GPT-5.5 into your enterprise workflows, you must first obtain API access. This typically involves registering with OpenAI or your organization’s AI platform provider and configuring authentication tokens.
Below is a Python example demonstrating a basic API call to GPT-5.5 with contextual system and user messages. This example assumes the use of OpenAI’s Python SDK.
import openai

# Set your API key securely
openai.api_key = "YOUR_API_KEY"

# Define the prompt and roles
response = openai.ChatCompletion.create(
    model="gpt-5.5",
    messages=[
        {"role": "system", "content": "You are an expert enterprise data analyst."},
        {"role": "user", "content": "Analyze sales data for Q1."}
    ],
    temperature=0.2,
    max_tokens=1500
)

print(response.choices[0].message.content)
Authentication Best Practices
- Use environment variables or secure vaults to store API keys rather than hardcoding.
- Implement role-based access control (RBAC) to restrict who can invoke GPT-5.5 APIs.
- Monitor API usage and set rate limits to control costs and prevent abuse.
Data Privacy and Compliance
Ensure your data complies with your organization’s privacy policies and regulatory requirements such as GDPR, HIPAA, or SOX when transmitting enterprise data to AI services. Consider on-premise or private cloud deployments of GPT-5.5 if sensitive data handling is required.
- Data Anonymization: Remove personally identifiable information (PII) before sending data to the API.
- Encryption: Use TLS/SSL for data in transit and encrypt sensitive data at rest.
- Audit Trails: Maintain logs of data sent to GPT-5.5 for compliance and troubleshooting.
- On-Premises Deployments: For ultra-sensitive environments, consider GPT-5.5 deployments within private infrastructure.
Practical Use Cases of GPT-5.5 in Enterprise Data Analysis
1. Spreadsheet Automation
One of the most common enterprise tasks is managing large spreadsheets. GPT-5.5 can automate formula creation, data validation, and even complex pivot table generation, saving analysts hours of manual work.
Example: Automating Variance Calculation in Excel
Suppose you have monthly sales data and want to calculate variance percentage between actual and budgeted sales. Traditionally, you would write formulas manually or copy-paste them, which is error-prone.
Prompt to GPT-5.5:
"Generate an Excel formula to calculate the percentage variance between actual sales in cell B2 and budgeted sales in cell C2. The formula should handle division by zero gracefully."
Expected GPT-5.5 response:
=IF(C2=0, "N/A", (B2 - C2) / C2)This formula ensures that if the budget is zero, it returns “N/A” instead of an error, otherwise it calculates the variance as a decimal fraction.
Advanced: Dynamic Formula Generation Across Ranges
You can prompt GPT-5.5 to generate array formulas or dynamic named ranges for variance calculations across entire columns, enabling scalable automation:
Prompt:
"Write an Excel formula to calculate percentage variance for actual sales in column B and budgeted sales in column C, starting from row 2 to the last row with data. Output should be in column D."
GPT-5.5 Output:
=IF(C2=0, "N/A", (B2 - C2) / C2)

Then drag the formula down from D2 to the last row.
Alternatively, with Excel 365 dynamic arrays:
=IF(C2:C1000=0, "N/A", (B2:B1000 - C2:C1000) / C2:C1000)Automating Conditional Formatting Rules
GPT-5.5 can generate VBA macros or conditional formatting rules based on business logic, reducing manual configuration time.
Prompt:
"Create a VBA macro that highlights cells in column D where the value exceeds 10% variance compared to column E. Use a light red fill color."
GPT-5.5 Output:
Sub HighlightVariance()
    Dim ws As Worksheet
    Set ws = ThisWorkbook.Sheets("Sheet1")
    Dim lastRow As Long
    lastRow = ws.Cells(ws.Rows.Count, "D").End(xlUp).Row

    Dim i As Long
    For i = 2 To lastRow
        If ws.Cells(i, "E").Value <> 0 Then
            If Abs(ws.Cells(i, "D").Value - ws.Cells(i, "E").Value) / ws.Cells(i, "E").Value > 0.1 Then
                ws.Cells(i, "D").Interior.Color = RGB(255, 199, 206) 'Light Red
            Else
                ws.Cells(i, "D").Interior.ColorIndex = xlNone
            End If
        Else
            ws.Cells(i, "D").Interior.ColorIndex = xlNone
        End If
    Next i
End Sub
Step-by-Step Guide to Use the Macro
- Open your Excel workbook and press
Alt + F11to open the VBA editor. - Insert a new module via
Insert > Module. - Paste the above VBA code into the module.
- Close the VBA editor and return to Excel.
- Run the macro via
Developer > Macros > HighlightVariance > Run. - The macro will highlight cells in column D with more than 10% variance compared to column E.
2. Variance Analysis with GPT-5.5
Variance analysis is critical for understanding deviations in financial performance. GPT-5.5 can assist in generating narrative explanations and identifying root causes by analyzing data patterns, enabling business teams to understand not just the numbers but the story behind them.
Step-by-Step Variance Analysis Workflow
- Data Preparation: Prepare a dataset with actuals, budgets, prior periods, and relevant metadata like time periods, departments, and products.
- Prompt Engineering: Design prompts that instruct GPT-5.5 to compare values, calculate variances, and provide explanations including possible causes.
- Automated Report Generation: Use GPT-5.5 output to generate textual summaries that complement numerical reports.
- Iterative Refinement: Review GPT-5.5 generated insights and refine prompts or input data to improve accuracy and relevance.
Example Prompt and Response
Prompt:
"Given the following data: Actual Sales: $1,200,000; Budget Sales: $1,000,000; Prior Year Sales: $1,100,000. Explain the variance and possible business reasons."
GPT-5.5 Response:
The actual sales exceeded the budget by $200,000, representing a 20% positive variance, and are 9.09% higher than the prior year. This could be attributed to increased market demand, successful promotional campaigns, or new product launches. Further investigation into sales channels and customer segments is recommended to pinpoint the drivers.
Extending Variance Analysis Across Multiple Dimensions
GPT-5.5 can be instructed to analyze variance by region, product line, or customer segment. For example:
Prompt:
"Analyze the following sales data by region and explain variances against budget:

- Region A: Actual $500,000, Budget $450,000
- Region B: Actual $300,000, Budget $350,000
- Region C: Actual $400,000, Budget $400,000"
GPT-5.5 Output:
Region A shows a positive variance of 11.11%, likely due to strong local demand or effective sales strategies. Region B has a negative variance of 14.29%, potentially caused by increased competition or supply issues. Region C met its budget exactly, indicating stable performance. Targeted action plans should be considered for Region B to address the shortfall.
3. Close Reporting Automation
Monthly and quarterly financial close processes can be streamlined with GPT-5.5 by automating narrative report generation and identifying anomalies in account reconciliations, saving time for finance teams and improving report quality.
Generating Close Summary Reports
GPT-5.5 can ingest trial balance data and produce coherent reports summarizing key financial movements, enabling faster review cycles and more comprehensive insights.
Prompt:
"Summarize the following trial balance movements: Revenue increased by 5%, COGS increased by 7%, SG&A expenses decreased by 3%."
Generated Summary:
During the period, revenue grew by 5%, indicating strong sales performance. However, the cost of goods sold increased by 7%, slightly outpacing revenue growth, which may pressure gross margins. Operating expenses decreased by 3%, reflecting efficient cost management within SG&A. Overall, the company maintained profitability despite cost pressures.
Automating Account Reconciliation Checks
GPT-5.5 can be guided to flag accounts where debits and credits do not match or where balances deviate significantly from expectations.
Prompt:
"Identify any anomalies or unreconciled differences in the following account balances:

Account A: Debit $100,000, Credit $100,000
Account B: Debit $50,000, Credit $48,000
Account C: Debit $75,000, Credit $75,000"
GPT-5.5 Output:
Account B has a $2,000 unreconciled difference between debits and credits. This discrepancy should be investigated to ensure accurate financial reporting.
4. Dashboard Insights and Anomaly Detection
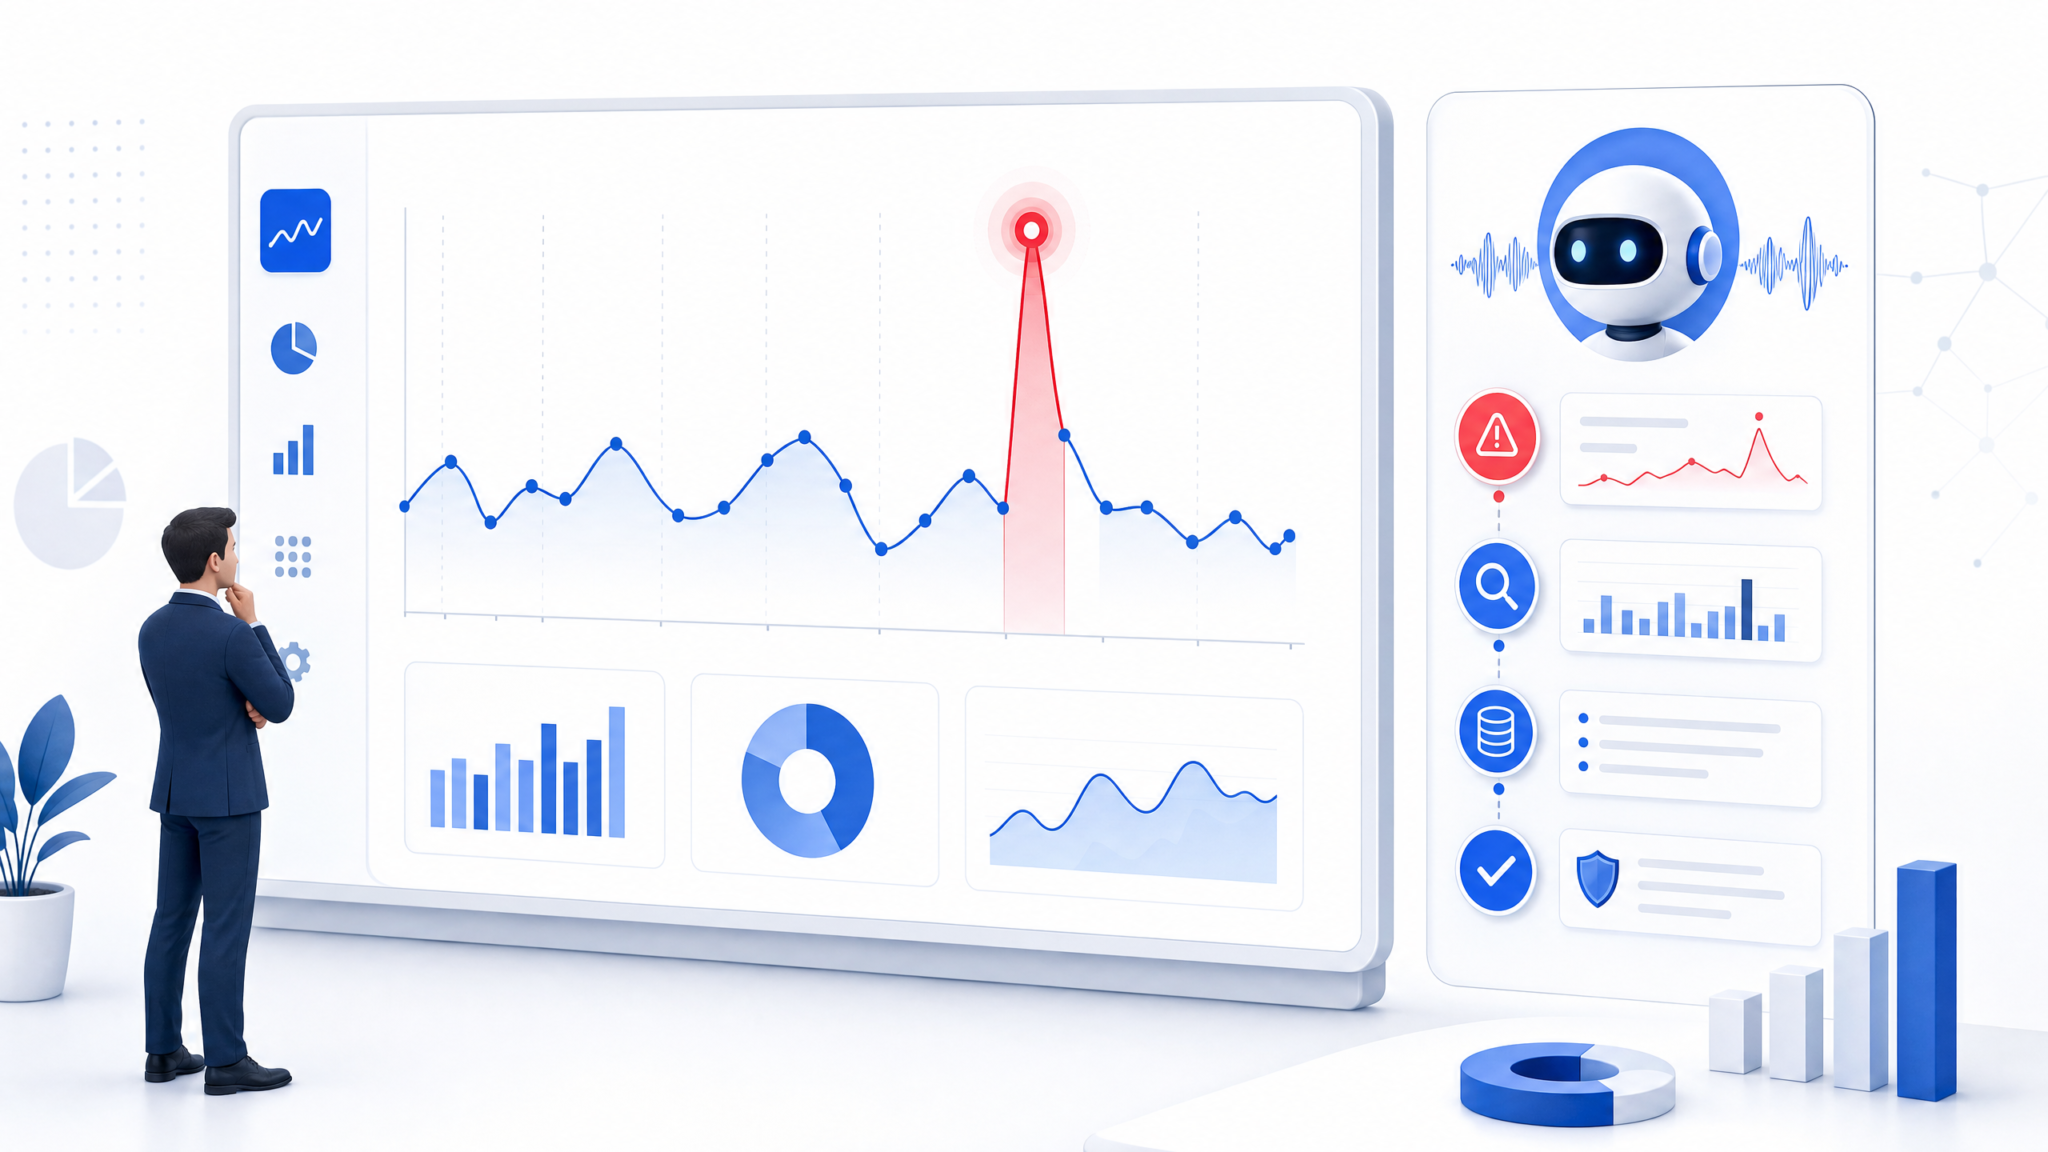
Beyond static dashboards, GPT-5.5 can provide dynamic commentary and detect anomalies in KPIs in real-time, transforming dashboards into interactive decision-support systems.
Anomaly Detection Algorithm Prompt
Prompt:
"Analyze the sales data below and identify any anomalies or unusual trends.
Sales data: [January: 100k, February: 98k, March: 102k, April: 150k, May: 105k]"
GPT-5.5 Analysis:
April sales show a significant spike to $150k compared to the surrounding months averaging around $100k. This could indicate a seasonal promotion, a one-time event, or data entry error. Further investigation is advised.
Integrating GPT-5.5 Insights into BI Dashboards
By embedding GPT-5.5 generated narratives into dashboard tools such as Power BI or Tableau, business teams can enrich visualizations with contextual explanations, improving user understanding and decision-making.
Example integration architecture:
| Component | Description |
|---|---|
| Data Source | Enterprise databases, spreadsheets, APIs |
| GPT-5.5 API | Generates insights and narratives based on input data |
| Middleware | Custom service to send data and receive GPT responses |
| BI Dashboard | Displays charts and embeds GPT-5.5 generated textual insights |

Technical Deep Dive: Implementing GPT-5.5 Data Analysis Pipelines
Architectural Overview
A typical GPT-5.5-powered enterprise data analysis pipeline consists of the following components:
| Component | Description | Technology Examples |
|---|---|---|
| Data Ingestion | Collect and preprocess enterprise data from ERPs, CRMs, spreadsheets. | Python (Pandas), SQL Extracts, API connectors |
| Prompt Engineering | Design and refine prompts to guide GPT-5.5 interactions. | Custom templates, prompt tuning tools |
| GPT-5.5 API Integration | Send data and prompts to GPT-5.5 and receive responses. | OpenAI SDK, REST API |
| Post-processing | Parse and format GPT outputs for reporting or dashboards. | Python scripts, JSON parsers, NLP libraries |
| Visualization & Reporting | Display insights in BI tools or generate PDF/Excel reports. | Power BI, Tableau, Excel VBA, ReportLab |
Step 1: Data Preparation and Formatting
Data must be cleaned and structured for GPT-5.5 to interpret effectively. For example, format spreadsheet data into JSON or CSV. Proper data normalization and removal of extraneous fields improve prompt relevance.
import pandas as pd

# Load Excel data
sales_df = pd.read_excel('monthly_sales.xlsx')

# Clean data: remove nulls, ensure correct data types
sales_df.dropna(inplace=True)
sales_df['Sales'] = sales_df['Sales'].astype(float)

# Convert to JSON for prompt embedding
sales_json = sales_df.to_json(orient='records')

print(sales_json)
Step 2: Crafting Effective Prompts
Effective prompt design is crucial. Include context, instructions, and data snippets. Use explicit roles and desired output format to guide GPT-5.5.
prompt_template = f"""
You are a financial analyst.
Here is the sales data for Q1:
{sales_json}
Please provide a variance analysis and highlight any anomalies.
Format your response with bullet points and a summary.
"""
Tips for prompt engineering:
- Use system messages to set the role (e.g., “You are a financial data expert.”)
- Request specific output formats (bullet points, tables, JSON) for easier post-processing
- Chunk large datasets and prompt sequentially if data exceeds token limits
Step 3: Calling GPT-5.5 API
Send the crafted prompt to the GPT-5.5 API with appropriate parameters for temperature, maximum tokens, and stop sequences.
import openai

openai.api_key = 'YOUR_API_KEY'

response = openai.ChatCompletion.create(
    model='gpt-5.5',
    messages=[
        {'role': 'system', 'content': 'You are an expert enterprise data analyst.'},
        {'role': 'user', 'content': prompt_template}
    ],
    temperature=0.3,
    max_tokens=1500
)

analysis = response.choices[0].message.content
print(analysis)
Step 4: Post-Processing and Integration
Parse the response to extract key insights. You can use regex or natural language processing libraries to identify sentences related to anomalies or variance explanations. For structured outputs, consider asking GPT-5.5 to respond in JSON.
import json
import re

# Example: Extract bullet points from response
bullet_points = re.findall(r'\u2022\s(.+)', analysis)

for point in bullet_points:
    print(f"Insight: {point}")

# For JSON output, parse normally
try:
    insights_json = json.loads(analysis)
    # Access structured fields
except json.JSONDecodeError:
    print("Response is not JSON formatted.")
Step 5: Embedding Insights into Dashboards
Use APIs or custom connectors to display GPT-5.5 generated text alongside charts. For example, Power BI supports embedding external text via HTML content or custom visuals.
Example Power BI integration steps:
- Create a web service that calls GPT-5.5 API and returns insights for a given dataset.
- Use Power BI’s Web connector to call this service.
- Parse and display the returned insights in a dashboard card or tooltip.
- Schedule refreshes aligned with data updates.
Advanced Techniques for Enhanced Enterprise Analysis
Fine-Tuning GPT-5.5 on Proprietary Data
For domain-specific accuracy, fine-tune GPT-5.5 with your enterprise’s historical financial reports, terminology, and workflows. This improves relevance and reduces hallucinations.
Example Fine-Tuning Workflow:
- Collect a corpus of historical reports, reconciliations, and analyst notes.
- Clean and format data into a supervised fine-tuning dataset.
- Use OpenAI’s fine-tuning APIs or private training pipelines.
- Validate performance on test queries.
Fine-tuning can include adding custom entity recognition for company-specific KPIs or jargon.
Multi-Modal Data Analysis
GPT-5.5 supports multi-modal inputs—integrate textual data with images, charts, or PDFs to generate richer analyses. For example, send screenshots of dashboards or financial statements along with data tables.
Example Multi-Modal Prompt:
Prompt:
"Analyze the attached sales chart image along with the quarterly sales data and summarize key trends and anomalies."
This capability enables business teams to combine visual and numerical data seamlessly.
Automated Anomaly Alerting System
Build real-time monitoring systems where GPT-5.5 flags unusual patterns and sends alerts to business analysts via email, Slack, or other communication platforms.
Example: Real-Time Sales Anomaly Alert
def detect_anomaly(sales_data):
    prompt = f"Analyze the following sales data for anomalies: {sales_data}"
    response = openai.ChatCompletion.create(
        model='gpt-5.5',
        messages=[
            {'role': 'system', 'content': 'You are a data analyst specialized in anomaly detection.'},
            {'role': 'user', 'content': prompt}
        ],
        temperature=0,
        max_tokens=500
    )
    return response.choices[0].message.content

# Example usage
sales_data = {'January': 100000, 'February': 98000, 'March': 102000, 'April': 150000, 'May': 105000}
alert = detect_anomaly(sales_data)
print(alert)
Integrating with Notification Systems: Use Python email libraries or Slack APIs to send alerts to relevant stakeholders automatically.
Comparison Table: GPT-5.5 vs Traditional Enterprise Data Tools
| Feature | GPT-5.5 | Traditional Tools (Excel, BI Platforms) |
|---|---|---|
| Natural Language Understanding | High – can interpret complex queries and generate narratives | Low – requires manual formula or query building |
| Automation | Automates formula creation, report writing, anomaly detection | Limited to macros, scripts, or manual operations |
| Multi-Modal Analysis | Supports text, images, charts, PDFs | Mostly text and numeric data |
| Scalability | Handles large datasets via chunking and API scaling | Limited by software and hardware capabilities |
| Integration | Flexible API-driven integration | Depends on platform connectors and manual ETL |
| Output Format | Customizable (text, JSON, tables) | Predefined by software features |
Best Practices for Business Teams Using GPT-5.5
- Iterative Prompt Refinement: Continuously refine prompts based on output quality and business context. Start with broad queries then narrow down for precision.
- Human-in-the-Loop: Combine GPT-5.5 outputs with expert reviews to ensure accuracy and compliance. Use AI suggestions as decision support rather than final authority.
- Version Control: Maintain prompt templates and code in repositories for collaboration and auditing. Track changes to understand evolution of analysis logic.
- Security: Encrypt sensitive data and restrict API access. Use anonymization where possible before data transmission.
- Integration: Use GPT-5.5 as a component within larger analytics platforms rather than a standalone tool, enabling synergy with traditional BI and ERP systems.
- Performance Monitoring: Regularly evaluate GPT-5.5 outputs for accuracy and relevance to avoid drift.
- Training and Education: Invest in upskilling analysts on prompt engineering and AI literacy.
Common Challenges and Solutions
Handling Large Datasets
GPT-5.5 has token limits (up to 64k tokens in some versions). To work around this, summarize or chunk data before sending prompts. Techniques include:
- Data Summarization: Pre-aggregate data to reduce volume.
- Chunking: Split data into logical blocks and analyze sequentially.
- Embedding Indexing: Use vector databases with embeddings for retrieval-augmented generation.
Ensuring Output Accuracy
Use system messages to set the context and instruct GPT-5.5 to verify calculations or cite data sources. Examples:
{
  "role": "system",
  "content": "You are a precise financial analyst. Verify all calculations before reporting."
}
Cross-check GPT outputs with raw data or use supplementary scripts to validate numeric results.
Mitigating Hallucinations
Hallucinations—fabrication of facts—can occur. Mitigation strategies include:
- Limit generation temperature to low values (0–0.3).
- Use fact-based prompts and provide source data explicitly.
- Require GPT-5.5 to cite data points or calculations explicitly.
- Cross-validate outputs with traditional analytics tools.
Stay Ahead with ChatGPT AI Hub
Get exclusive tutorials, prompt libraries, and breaking AI news delivered to your inbox every week.
Conclusion
GPT-5.5 represents a transformative leap for enterprise data analysis, enabling business teams to automate complex workflows, uncover actionable insights, and make data-driven decisions faster. By mastering prompt engineering, integrating GPT-5.5 with existing data infrastructure, and applying best practices, analysts can unlock the full potential of AI-enhanced analytics.
As enterprises increasingly adopt AI for finance and business intelligence, GPT-5.5 stands out as a versatile and powerful tool for data analysis, reporting, and anomaly detection.
For further learning, explore our tutorials on ChatGPT prompting techniques and OpenAI Codex for developers.
Article by Markos Symeonides
