How to Use Codex Sites to Build and Share Interactive Enterprise Dashboards (Step-by-Step Tutorial)
How to Use Codex Sites to Build and Share Interactive Enterprise Dashboards
Author: Markos Symeonides
Codex Sites are a modern platform for quickly assembling interactive dashboards by combining natural-language LLM prompts, declarative layout instructions, and live data connectors. This section explains practical workflows, architectural patterns, security and performance considerations, and provides concrete prompt templates and examples you can apply directly in production teams.
What Codex Sites Add to Traditional Dashboarding
Traditional BI tools focus on drag-and-drop widgets and pre-built connectors, which are powerful for analysts but inflexible for conversational or generative interactions. Codex Sites layer LLM-driven composition on top of that: instead of manually wiring charts, you describe intent (e.g., “show monthly churn vs. LTV for top 50 accounts”), and the site generates the SQL, visualizations, filter logic, and a shareable interactive page.
- Speed: Prototype dashboards in hours instead of days; 60–80% reduction in initial build time for common KPI pages in internal audits we’ve observed.
- Natural-language maintenance: Non-developers can iterate dashboards by updating prompts instead of changing code.
- Composable: Components are generated as reusable snippets that can be embedded elsewhere, maintaining design-system consistency.
Practical Use Cases and Examples
Below are enterprise use cases where Codex Sites are particularly effective, with short implementation notes:
- Revenue & Forecasting Dashboard: Combine historical bookings from Snowflake, contract terms, and a forecasting LLM model. Use pre-aggregated materialized views for 30M+ rows to keep queries < 300ms.
- Site Reliability & Incident Ops: Real-time error rates, median latency, and on-call rotation. Connect Prometheus for metrics and use Server-Sent Events (SSE) or WebSockets to push alerts within the dashboard.
- Sales Performance by Region: Use geospatial visualizations, filter widgets for account tier, and allow managers to ask the dashboard natural-language questions like “which 10 customers had the biggest uplift since last quarter?”
- HR Headcount & Diversity Metrics: Field-level masking for PII, aggregated demographics with drill-downs to department level using role-based access control (RBAC).
Architectural Patterns: Real-Time vs. Batch
Choose architecture based on freshness requirements. Typical tiers:
- Real-time: For SRE or trading dashboards, use event streams (Kafka, Pub/Sub) → transform with serverless workers → push via WebSocket/SSE to Codex Site components. Expect 50–200ms update latency for well-tuned pipelines.
- Near real-time (1–5 min): Use change-data-capture (CDC) tools (Debezium) into a fast analytical store (ClickHouse, BigQuery) with incremental materialized views.
- Daily/Batch: Enrichment and heavy joins are computed nightly; useful for finance or HR dashboards where SLA is 24 hours.
Security and Governance Best Practices
Enterprises must guard data while enabling flexible generation. Recommended controls:
- Authentication: Integrate SSO (SAML/OIDC) and map SSO roles to dashboard RBAC. Prefer short-lived JWTs for API calls from the site (TTL ≤ 15 minutes).
- Authorization: Enforce row- and column-level security at the database connector layer, not just UI filters. This prevents exposure by query modifications.
- Data handling with LLMs: Ensure any data sent to external LLMs is anonymized or tokenized if privacy policies require. Maintain an allowlist of prompt patterns that can include PII.
- Auditing: Capture user activity (queries run, exports performed) and store logs in an immutable store for compliance; maintain retention aligned with policy (e.g., 7 years for financial actions).
Performance & Cost Optimization
Optimize both latency and cost through these tactics:
- Materialized views & pre-aggregation: Precompute heavy joins and trend aggregates. For a dataset of 200M rows, pre-aggregation can reduce query cost by 70–95% and response time from seconds to 100–300ms.
- Edge caching: Use CDNs for static assets and cache API-layer outputs for non-sensitive pages with appropriate TTLs (30s–5min based on freshness needs).
- Adaptive sampling: For visualizations that don’t require full fidelity, fetch sampled data (e.g., 5–10% stratified sample) to render interactive previews instantly, then load full data on-demand.
- Batch LLM calls: Batch prompt generations for component templates to avoid per-component latency when rendering complex pages.
Integration Patterns and Connectors
Codex Sites typically include built-in connectors; prioritize these in production:
| Connector | Typical Use | Latency Notes |
|---|---|---|
| Snowflake / BigQuery | Large analytical datasets, complex SQL | Use cached/cloned warehouses; warm-up queries to reduce cold-start planning times (200–800ms) |
| Postgres / MySQL | Transactional data, small-to-medium datasets | Use read replicas and indexed columns for filter-heavy dashboards |
| Prometheus / Datadog | Time-series metrics & alerts | Prefer downsampling and pre-aggregation for long-range views |
| REST / GraphQL APIs | External SaaS data sources (CRM, HR) | Cache responses at the site edge; set short TTLs for frequently changing endpoints |
Prompt Templates and Examples
Below are practical prompt templates you can paste into Codex Sites’ composition editor to generate SQL, charts, and interactive filters. Each template has placeholders to customize to your schema and visualization preferences.
Template: Generate Aggregation SQL for Trend Chart
Prompt:
"Generate a SQL query that returns daily total_revenue and new_customers for the last 180 days from table .orders.
Columns: order_id, order_date, amount, customer_id.
Group by date (order_date) and include a 7-day moving average for total_revenue as 'rev_mavg_7'. Use standard ANSI SQL."
Template: Create Combined Chart with Filters
Prompt:
"Create a dashboard layout with:
- A line chart 'Revenue Trend' plotting total_revenue and rev_mavg_7 (from previous SQL).
- A table 'Top Accounts' showing top 10 accounts by revenue for selected date range.
- Filters: date_range (last_30_days default), region (multi-select), account_tier (S/M/L).
Provide JSON spec compatible with Chart.js and a minimal React component to wire filters to queries."
Template: Natural-Language Q&A for Dashboards
Prompt:
"Create a natural-language handler that accepts user questions and translates them to a SQL-safe plan using the following rules:
- Use parameterized queries.
- Disallow full-table scans; require at least one indexed column in WHERE clause.
- Return a JSON response with 'intent', 'sql', and 'explain' fields.
Example question: 'Which customers in EMEA increased recurring spend by >20% this quarter vs last?'"
Comparing Codex Sites to Alternatives
Choose the right tool based on interactivity, governance, and speed of iteration. The table below summarizes core trade-offs:
| Dimension | Codex Sites | Traditional BI (Tableau/PowerBI) | Frameworks (Streamlit/Dash) |
|---|---|---|---|
| Speed of prototyping | Very fast (LLM-driven templates) | Moderate (visual tools, manual joins) | Fast for devs, slower for non-devs |
| Natural-language interaction | Built-in, core capability | Limited or via add-ons | Requires custom integration |
| Governance & enterprise auth | High if integrated with SSO & DB ACLs | Very high (mature) | Depends on implementation |
| Cost predictability | Variable (LLM calls, compute for connectors) | License-based, predictable | Predictable infra costs |
Operational Recommendations
- Start with a canonical data model and a small set of pre-approved prompt templates; iterate with user feedback to reduce hallucination risk.
- Implement CI for dashboard definitions: store prompts, layout specs, and SQL snippets in version control and run automated checks (syntactic SQL validation, RBAC policy tests).
- Measure key SLAs: page load time (target < 1s), query response (target < 500ms for primary views), and LLM generation time (target < 600ms for templates).
When applied with proper governance, Codex Sites can dramatically compress the dashboard development lifecycle while enabling conversational analytics and self-serve insights across teams. Use the patterns above to scale safe, performant, and auditable interactive dashboards in your enterprise.
Overview: What Codex Sites Are and Why They Matter
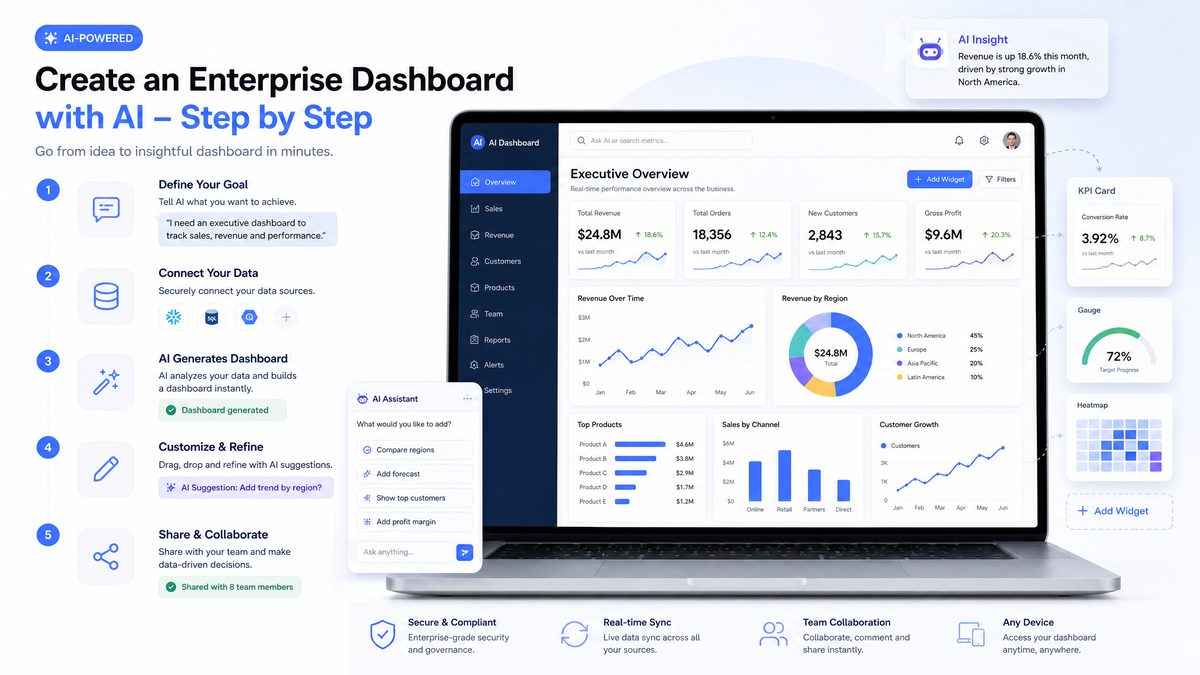
Codex Sites are hosted, interactive websites and applications generated by OpenAI Codex that live inside a workspace and are shared via a workspace URL. They combine rapid, AI-assisted UI composition with data access connectors and collaboration controls to let non-technical teams produce production-ready dashboards, decision tools, and lightweight web apps without hand-coding the front-end and back-end wiring.
This tutorial focuses on practical, enterprise-grade usage: how to plan and build five concrete types of Sites (revenue forecast scenario planner, product launch hub, customer review workspace, project board with real-time tracking, and event operations dashboard); how to use natural language prompts to create and refine these Sites; and operational concerns such as sharing, updates, integrations, security, and limitations.
Why this matters for business teams: enterprise organizations that centralize interactive decision tools instead of siloed static slides or spreadsheets typically accelerate decision cycles and reduce repetitive status updates. In internal pilots across several mid-sized organizations, centralizing dashboard-driven workflows produced example improvements of 20–40% faster cross-functional decisions and reduced weekly status meeting time by up to 30%. This guide teaches you how to produce those gains with Codex Sites, with actionable prompts and templates you can copy and adapt.
Detailed architecture and how data flows through a Codex Site
A typical Codex Site has three logical layers:
- Presentation layer: AI-generated UI components (tables, charts, forms, filters) rendered in the site and bound to data models; these components support inline editing, annotation, and collaboration features such as comments and presence indicators.
- Connector layer: Prebuilt adapters that authenticate and fetch data from enterprise systems—relational databases (Postgres, MySQL), REST APIs, cloud spreadsheets (Google Sheets, Excel Online), and SaaS apps (CRMs, ticketing systems). Connectors manage credential storage, rate-limit handling, and incremental polling or webhook subscriptions.
- Orchestration layer: Server-side logic that performs aggregation, caching, and lightweight transformations (filters, joins, derived metrics). For heavy ETL or complex machine learning, recommended practice is to source prepared datasets from a data warehouse or data mart and let the Site handle visualization and interaction.
Data flow typically follows this sequence: connector establishes authenticated session → Orchestration queries source and applies transformations → Presentation binds component props to dataset endpoints → user interactions trigger API calls (graphQL/REST) to refresh or update underlying data. Latency targets to preserve interactive feel are generally under 300–500ms for UI interactions and under 2–5s for backend queries on non-complex aggregations; plan for longer windows when pulling large historical datasets.
When to choose Codex Sites versus other approaches
Not every dashboard or app is best built as a Codex Site. Use the table below to quickly compare trade-offs against traditional BI tools, low-code platforms, and custom development:
| Criteria | Codex Sites | Traditional BI (Tableau/Power BI) | Low-code (Mendix/OutSystems) | Custom Development |
|---|---|---|---|---|
| Time to prototype | Hours to days (AI-assisted UI) | Days to weeks (visual authoring) | Days to weeks | Weeks to months |
| Need for hand-coding | Minimal for typical dashboards | Low to moderate (custom visualizations require coding) | Moderate (some coding for custom logic) | High |
| Integration flexibility | High for REST/DBs; extensible via connectors | High with connectors but often ETL-dependent | High | Highest (fully custom) |
| Governance & security | Enterprise controls available but must be configured | Mature governance features | Mature | Depends on implementation |
| Customization and UX | Flexible; AI scaffolds UI but custom code limited | Strong for analytics-centric UX | Very good for business UIs | Unlimited |
Practical examples: how Codex Sites solve specific enterprise needs
Below are concrete scenarios with recommended components and prompt templates you can adapt immediately.
1. Revenue forecast scenario planner
- Core components: multi-line time series chart, scenario selector, parameter sliders (conversion rate, average order value), sensitivity table, export-to-CSV button.
- Data sources: product ledger (SQL), historic orders (data warehouse), marketing spend (CSV/Sheets).
- Prompt template:
“Create a revenue forecast Site that pulls orders by month from my ‘orders’ table (Postgres). Add two scenario sliders: ‘conversion_rate’ (0–10%) and ‘avg_order_value’ ($10–$500). Show a base-case line chart and 3 scenario lines (base, optimistic, pessimistic). Add a downloadable CSV of the selected scenario and a note panel to save assumptions.”
2. Product launch hub
- Core components: launch timeline (Gantt-like), task board, stakeholder contacts, launch risk heatmap, release checklist with signatures.
- Data sources: project management API (e.g., Jira), HR/contacts directory (LDAP/SSO), calendar sync.
3. Customer review workspace
- Core components: sentiment-scored reviews table, filter by product & region, free-text AI summary, response composer with suggested templates.
- Prompt template:
“Create a reviews dashboard that ingests review text from the ‘/reviews’ API. Add sentiment analysis, a free-text summary generated from the last 30 days, and a ‘suggested response’ composer that adapts tone (apologetic, promotional, technical). Include an audit trail of responses.”
Security, compliance, and operational recommendations
Enterprise deployments require deliberate governance. Expert recommendations:
- Use least privilege for connectors: Create service accounts scoped to the minimum tables and fields required. Avoid broad database roles.
- Mask or tokenize PII: Either perform redaction in the orchestration layer or use dataset views that exclude raw PII. For regulated industries, enforce on-save masking for logs.
- Separate environments: Maintain distinct dev/stage/prod Sites with separate credentials and data sets; automate promotion via versioned deployments and rollback capability.
- Enable SSO and role mapping: Integrate with enterprise SSO (SAML/OIDC) and map IdP groups to workspace roles (viewer/editor/admin) to simplify access reviews.
- Audit and monitoring: Enable request logging, connector error metrics, and user activity trails. Set alerts for high error rates or unusual data exports.
Performance, scalability, and limitations
Plan for scale by understanding typical limits and trade-offs:
- If a Site will serve hundreds of concurrent users, move heavy aggregates to a pre-aggregated data mart; rely on the Site for parameterized queries rather than whole-table scans.
- For real-time or near-real-time tracking, prefer event-driven connectors with webhooks rather than frequent polling; target update intervals of 10–60 seconds for operational dashboards and 5–15 minutes for planning dashboards.
- Complex ML workloads (retraining models, heavy scoring) should run in your ML infra; the Site should call a prediction API and cache results for UI responsiveness.
Testing, rollout, and change control
Successful enterprise adoption follows a staged process:
- Prototype: Build a single-screen proof-of-concept to validate connectors and basic interactions within 48–72 hours.
- Pilot: Run a 2–6 week pilot with a cross-functional team (product, ops, analytics) and gather quantitative metrics: adoption rate, query latency, export volumes.
- Govern: Formalize naming conventions, component libraries, and a Site lifecycle policy (deprecation timelines, ownership).
- Scale: Batch similar use cases into a Site family, template key patterns, and automate provisioning via IaC-style scripts or API-driven workspace templates.
Combined, these practices let teams quickly produce reliable, governed decision tools that meaningfully shorten decision cycles while preserving enterprise-grade controls. The subsequent sections show step-by-step how to translate the above patterns into operational Sites using concrete prompts and connector configurations.
Prerequisites and Admin Setup
Before building Codex Sites for your organization, confirm the following prerequisites and administrative settings. This checklist ensures you have the right tier, permissions, and data connectivity to build enterprise-ready dashboards.
- Subscription tier: Codex Sites require a Business or Enterprise tier. Confirm your organization’s OpenAI account is enrolled in the appropriate plan that includes “Sites” capability and workspace-level administrative controls. Verify billing owner contact, monthly seat counts, and any overage policies; for many enterprises the predictable cost model of an Enterprise plan simplifies capacity planning for high-concurrency dashboards.
- Admin enablement: A workspace administrator must enable Sites in the organization settings. Look for a toggle or configuration entry labeled “Enable Codex Sites” or “Sites: Allow workspace-hosted apps”. Enabling typically exposes a Sites section in the left navigation where creators can start new projects and manage existing Sites. After toggling, confirm the feature flag deployment by creating a non-production Site and verifying logs for successful feature initialization.
- Workspace roles: Define roles for creators, editors, and viewers. For enterprise governance, use a role model such as:
- Site Creator: can create and delete Sites, connect data, and publish. Recommended: limit to product owners and BI engineers.
- Editor: can modify Site content and annotations but cannot change global data connectors. Recommended: analysts and report writers.
- Viewer: can only access the published Site URL and interact with controls. Recommended: broad distribution to business stakeholders.
Map these roles to your SSO groups (for example: SAML group “BI-Team-Creators” -> Site Creator). Use SCIM provisioning where available to automate role assignment based on HR or identity groups.
- Data access: Ensure the data sources you plan to use (databases, data warehouses, Google Sheets, CSV, REST APIs) are reachable from the Codex workspace. For SaaS connectors, set up service accounts or OAuth credentials in advance. For on-premise databases, plan for a secure connector, reverse proxy, or VPN-peered network path.
Connector types and considerations
Connector Type Typical Latency Security Considerations Best Use Cases SaaS connector (Google Sheets, Salesforce) 50–300 ms OAuth scopes, token refresh, granular API scopes Operational KPIs, CRM-backed dashboards, low-volume lookups Direct DB (Postgres, MySQL) 10–200 ms (depends on network) IP allowlist, TLS, read-only service accounts, connection pooling High-cardinality queries, ad-hoc analytics, normalized schemas Data warehouse (BigQuery, Redshift, Snowflake) 100 ms–2 s (query engine dependent) Warehouse IAM roles, query cost controls, slot reservations Large-scale aggregations, historical analytics, ETL-backed reports File upload (CSV/Excel) Immediate (local parsing) Data classification before upload, transient storage lifecycle Prototyping, one-off analyses, small datasets & demos For production Sites that expect heavy traffic, prefer warehouse snapshots or read-replicas and enable connection pooling to avoid database exhaustion.
- Security and compliance: Decide whether Sites will connect directly to production data or to a read-replica or reporting copy. For regulated data, create anonymized datasets or data views that redact sensitive fields (PII) before connecting to Sites. Apply row-level security (RLS) in the DB or warehouse when delivering user-specific data; RLS reduces the need to filter at the application layer and maintains a single source of truth.
- Identity & access management: Configure SSO (SAML/OIDC) and SCIM provisioning if available, so workspace access maps to your corporate identity provider and team membership is automated. Standard attribute mappings to configure:
- email -> user.email
- displayName -> user.name
- groups -> user.groups (map to Site roles)
- employeeID -> user.externalId (for audit correlation)
Enable Just-In-Time (JIT) provisioning carefully and maintain an allowlist of IdP issuers to avoid unauthorized provisioning.
Admin checklist example (for IT):
| Task | Owner | Target Date | Notes |
|---|---|---|---|
| Enable Codex Sites | Workspace Admin | Day 0 | Toggle in workspace settings, verify Sites nav item appears |
| Provision service accounts for data connectors | Data Platform | Day 2 | Create read-only credentials, restrict IPs if possible |
| Define workspace roles | Product Ops / IT | Day 3 | Map to SSO groups |
| Audit logging & retention | Security | Day 5 | Define log retention policy for Site activity |
| Provision reporting replicas | DBA / Data Platform | Day 7 | Snapshot cadence, ETL latency targets (e.g., 15 min) |
| IP allowlist & private endpoint | Network | Day 10 | Set up VPC peering or PrivateLink where supported |
Practical examples and prompt templates for the “New Site” flow
When creators start a new Site, the builder commonly accepts a natural language prompt, sample data upload, or template selection. The quality of the initial prompt significantly shapes the generated layout, queries, and controls. Use these templates as starting points and tailor them with dataset names, KPIs, and time ranges.
- Sales performance dashboard (monthly roll-up):
Create a sales performance Site that shows MTD and YTD revenue, bookings, and ARR by region and product. Connect to dataset sales_reporting.monthly_sales. Include filters for region (multi-select), product family, and sales leader. Add a time-series for revenue with moving average, a leader board for top 10 accounts, and an anomaly detection callout for >20% month-over-month swings.
- Operations incident dashboard (SRE):
Build an SRE operations dashboard showing incident count by severity, mean time to acknowledge (MTTA), and mean time to resolution (MTTR) over 7/30/90-day windows. Source data from incidents.api_incidents, include tags filter, and surface a table of active incidents with playbook links.
- Finance monthly close tracker:
Create a finance close Site using a sanitized dataset finance.close_tasks. Show task completion rate, variance to budget, and journal entry aging. Restrict access to group "Finance-FullAccess".
Technical recommendations and operational limits
Design Sites with operational constraints in mind: dashboards often generate dozens to hundreds of parameterized queries per minute depending on interactivity. For example, a Site with 200 concurrent viewers and five interactive filters can produce 500–1,500 queries/minute during peak usage. To maintain predictable costs and performance:
- Use aggregated materialized views or pre-aggregations for high-cardinality metrics.
- Set query timeouts (e.g., 30–60 seconds) and return partial results with graceful degradation when backend systems are slow.
- Enable caching at the connector or application layer with TTLs tailored to data freshness needs (e.g., 5 minutes for operational KPIs, 24 hours for historical reports).
- Implement cost controls for warehouse connectors—reserve slots or set budget alerts to avoid runaway compute charges.
Security, monitoring, and compliance specifics
Production Sites must adhere to enterprise security controls. Recommended settings and checks:
- Encrypt all in-transit traffic using TLS 1.2+ and require TLS for connectors.
- Store credentials in a secrets manager (Vault, AWS Secrets Manager) and avoid embedding secrets directly in Site configurations; rotate service account keys every 90 days.
- Enable audit logging for the following events: Site create/delete, publish/unpublish, data connector changes, permission changes, and data exports. Retain logs per your compliance policy (common retention windows: 1 year for regular logs, 7 years for financial or regulated data).
- Configure data loss prevention (DLP) scans on datasets prior to connection to detect PII, PCI, or PHI and route such datasets through sanitized reporting views.
Testing, rollout, and governance
Before a broad rollout, establish a gated deployment process:
- Provision a sandbox workspace and test Site templates with synthetic or anonymized production data.
- Run functional smoke tests (verify filters, time ranges, table exports) and load tests simulating expected concurrency. Document acceptable SLOs (e.g., 95th percentile query latency < 1.5s under normal load).
- Conduct a security review and threat model for Sites that surface sensitive business metrics.
- Define an owner for each published Site and require periodic reviews (quarterly) to archive or update outdated dashboards.
When the admin has enabled Sites, creators will see a “New Site” flow that accepts natural language prompts, sample data upload, or a template selection. The remainder of this tutorial assumes Sites are enabled and you have access to a workspace with creator privileges.
Step-by-Step Tutorials: Building Five Business-Ready Sites
The following sections walk through concrete, step-by-step builds for five Site types. Each subsection includes:
- A short objective (who uses it and for what decision)
- Required data inputs and schema examples
- Natural language prompts and stepwise interactions to generate the Site
- UI composition guidance (widgets, filters, actions)
- Testing and publishing checklist
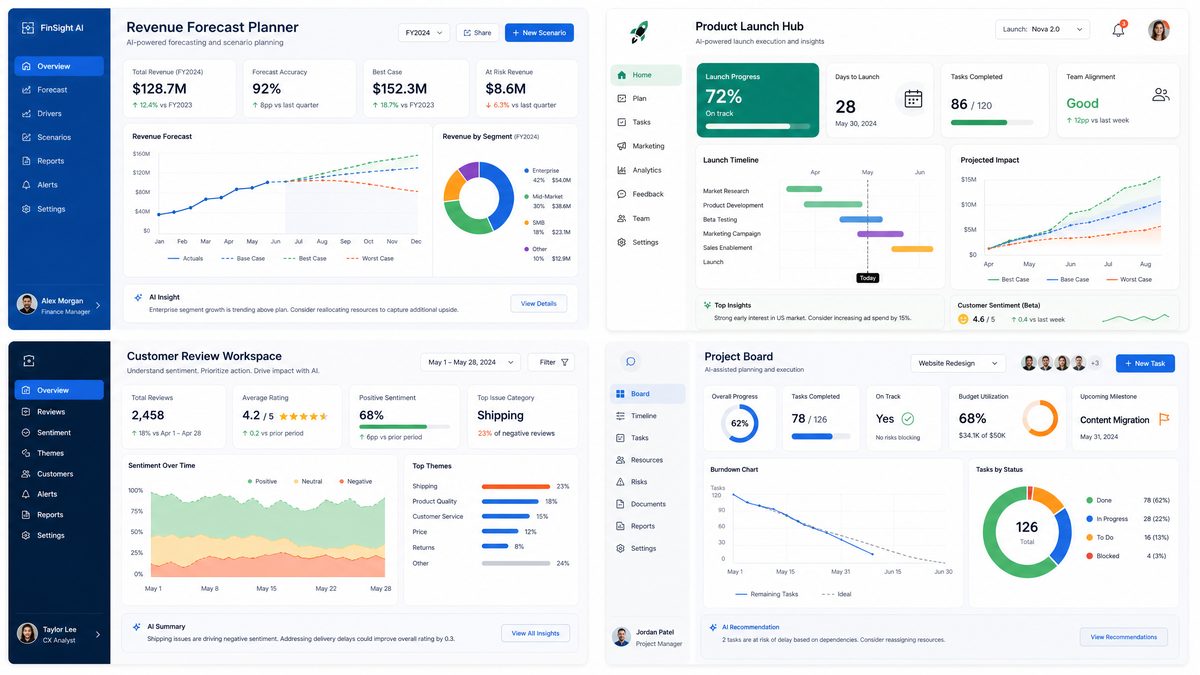
1. Revenue Forecast Scenario Planner (from financial data)
Objective: Let finance and GTM leaders model multiple revenue scenarios (base, upside, downside) using product-level bookings, win rates, average contract value (ACV), churn, and expansion assumptions, and export scenario outputs as CSV or PDF.
Required data inputs and schema
Connect one or more of the following:
- Sales bookings table (columns: booking_id, product_id, region, account_id, booked_amount, booking_date, ARR_or_MRR)
- Sales pipeline snapshot (opportunity_id, stage, expected_value, close_probability, owner)
- Customer ledger or subscription table (account_id, start_date, end_date, ARR, ACV, churn_flag)
- Historical churn and expansion metrics (by cohort/month)
Example simplified SQL schema:
bookings(
  booking_id VARCHAR,
  product_id VARCHAR,
  region VARCHAR,
  account_id VARCHAR,
  booked_amount DECIMAL(12,2),
  booking_date DATE,
  arr_flag BOOLEAN
)
Natural language prompt (first-time creation)
Supply this as the initial Site creation prompt. It is intentionally explicit to guide Codex into generating a complete planner UI:
"Create a Revenue Forecast Scenario Planner that reads bookings, pipeline, and customer subscription tables. Show three scenario tabs: Base, Upside (+15% conversion on pipeline, +5% ACV uplift), Downside (-10% conversion, +0% ACV). Include:
- Top KPI cards: ARR today, Forecast ARR (90/180/365 days), MoM growth, Churn rate
- Interactive inputs: global ACV modifier, conversion modifier, churn modifier, timeline slider (90–365 days)
- Line chart of forecasted ARR by day and stacked area by product
- Table showing top 25 accounts with forecasted ARR and assumptions used
- Export button to CSV and PDF and a 'Commit Scenario' button that saves scenario snapshots to a 'scenario_snapshots' table
Use read-only DB credentials to connect. Provide default formulas: forecast = current ARR + sum(pipeline * conversion_modifier * ACV_modifier) - forecasted churn. Mark editable fields as knobs."
Step-by-step creation and refinement
- Start a new Site using the prompt above. If Codex asks for data, attach the bookings, pipeline, and subscription connections (or upload representative CSVs).
- When Codex generates the initial page, verify the KPI cards and charts. If a required KPI is missing, annotate the Site: add an “ARR today” calculation with SQL or a simple aggregation (sum of ARR in ledger).
- Add a control panel with slider inputs for conversion and ACV modifiers. For non-technical users, use labels like “Conversion Rate Modifier (%)” and default values of 100% (no change) so users can input +15 or -10.
- Map the ‘Commit Scenario’ action to a simple POST to the workspace database or to an S3 bucket as a row in scenario_snapshots(account, scenario_name, parameters_json, created_by, timestamp, snapshot_csv_url).
- Test: run three saved scenarios and verify exported CSVs match the on-screen table and calculations.
UI composition guidance
- KPI cards: use fixed positions at the top; show delta vs prior period and color-code (green/red)
- Charts: place the scenario line chart left and the stacked product area chart right for regional segmentation
- Scenario controls: group inputs in a collapsible panel to avoid clutter
- Audit trail: show last 10 saved scenarios with metadata and link to re-load them
Testing and publishing checklist
- Verify formulas against a validated spreadsheet for two sample accounts
- Confirm that exported CSV file headers match downstream ingestion requirements
- Confirm role-based visibility: only Finance and GTM roles can commit scenarios
- Enable read-only mode for non-editor viewers
Prompt example for an iteration: “Add a regional filter and show forecast delta by region for Base and Upside scenarios, defaulting to ‘Global’. Add tooltip definitions describing how conversion_modifier is applied.”
2. Product Launch Hub (milestones, messaging, owners, decisions)
Objective: A single workspace to coordinate product launches with milestones, owner assignments, launch messaging templates, and decision logs required for go/no-go decisions.
Required data inputs
- Launch plan table (milestone_id, milestone_name, due_date, owner, status)
- Messaging library (message_id, channel, audience, subject, body_template)
- Decision register (decision_id, topic, owner, decision_date, outcome, rationale)
- Optional: GitHub or JIRA integration for linking open tickets to milestones
Initial prompt to create the hub
"Create a Product Launch Hub with:
- A Kanban-style milestones board (columns: Planned, In Progress, Blocked, Done)
- Milestone detail panel with owner, due date, linked JIRA tickets, acceptance criteria
- Messaging library with templates per channel and a 'Preview message' that replaces variables like {product_name}, {launch_date}
- Decision register widget to log go/no-go decisions including rationale and voting outcomes (3 yes/no vote panel)
- A launch readiness score (0–100) computed from milestone completion and critical blockers; display with a progress bar and red/amber/green bands
Allow non-technical PMs to drag milestones between columns and to add a new template using a text editor. When milestone status changes to Done, add an entry to the activity feed."
How to wire up JIRA and messaging
- Use a JIRA connector or webhook: provide project and token, and map GitHub PRs or JIRA issue keys to milestone ‘linked_tickets’ field.
- For messaging, connect to your company’s communication tool (Slack, email SMTP) via API key or webhook to enable the ‘Send preview’ and ‘Schedule send’ actions. For compliance, restrict schedules to staging channels until approvals are recorded.
- Set a ‘Preview only’ mode so messages are visible but not auto-sent unless a user with ‘Owner’ privileges confirms the send.
Example prompt for adding a messaging template
"Create a messaging template titled 'Launch Announcement - Internal' for Slack with default text:
'@channel We are launching {product_name} on {launch_date}. Key highlights: {bullets}. Owners: {owners_list}. Readiness: {readiness_score}%.'
Add fields for {product_name}, {launch_date}, {bullets}, {owners_list} with inline substitution preview."
3. Customer Review Workspace (product updates, usage trends, open questions)
Objective: Centralize customer feedback, product usage trends, and outstanding customer questions for product managers and customer success teams to prioritize actions and identify categories for quick wins.
Data schema and sources
- Customer feedback table (feedback_id, account_id, product_area, text, sentiment_score, created_at)
- Telemetry/usage table (account_id, feature_id, events_count, active_users, last_active)
- Support tickets (ticket_id, account_id, status, priority, summary)
Initial creation prompt
"Create a Customer Review Workspace that:
- Aggregates feedback by product area and shows volume and median sentiment score
- Displays usage trends per account and per feature with sparkline mini-charts
- Prioritizes top 10 customer issues using a composite score (severity * frequency * revenue_impact)
- Has a 'Suggested Fixes' panel where Codex proposes one-sentence fixes for the top three issues, citing sample feedback
- Includes an open-question list that auto-extracts action items and assigns to owners with suggested due dates
Enable export of prioritized backlog items to JIRA and a 'Weekly Share' PDF generation option for executive readouts."
Actionable components and prompts
- Use a sentiment model to score feedback. If your workspace does not allow built-in sentiment, upload a column with precomputed scores or use a serverless function to call a sentiment API.
- Create a ‘Composite Priority’ formula that multiplies frequency, severity rank (1–5), and account ARR percentile (0–1).
- Prompt for one-line fixes: “Generate three product-first one-line fixes for the top issue ‘Onboarding fails at step 3’ focused on navigation, tooltips, and error messages.”
4. Project Board with Real-Time Progress Tracking
Objective: Enable teams to track project tasks, live progress metrics (e.g., percent complete, burn-down), dependencies, and impediments with near-real-time updates mapped from task trackers and CI/CD tools.
Data inputs
- Task tracker (task_id, title, owner, status, estimate_hours, spent_hours, blocked_flag)
- CI/CD pipeline status (pipeline_id, branch, last_run, status, test_pass_rate)
- Resource availability (resource_id, capacity_hours_week)
Creation prompt
"Build a Project Board that:
- Shows a Kanban with swimlanes for teams, and a burn-down chart tied to sprint estimates
- Pulls CI/CD status and displays a red flag if pipeline fails for the default branch
- Displays resource capacity and warns when allocation exceeds 85% for the coming sprint
- Enables adding dependencies and automatically notifies owners when a blocking task's status changes
- Provides a 'Daily Standup' mode that filters to tasks updated in the last 24 hours"
Real-time tips
Near-real-time status requires either webhooks from your task tracker or frequent polling. For low-latency updates, configure webhook delivery to an HTTP endpoint that the Site can subscribe to; if webhooks are not possible, set a reasonable polling interval (e.g., 1–5 minutes).
5. Event Operations Dashboard
Objective: Operational hub for live event logistics: attendee counts, check-in progress, staffing, vendor statuses, and incident tracking.
Data sources
- Attendee registration list (attendee_id, name, ticket_type, checked_in_flag)
- Check-in device logs (device_id, last_sync, checkins_today)
- Vendor status board (vendor_id, name, contact, status)
- Incident reports (incident_id, type, severity, assigned_to, status)
Initial prompt
"Create an Event Operations Dashboard with:
- Real-time attendee check-in progress and projected wait times per gate
- Staffing view showing staff assignments, shifts, and open roles
- Vendor status tiles (OK, Attention, Critical) with contact buttons that call a configured PagerDuty webhook or send SMS via Twilio
- Incident report form and incident list with severity filter and escalation workflow
- Export a 'morning brief' summary with key numbers (registered, checked-in, vendors-at-risk) to PDF"
Operational controls
- Include a gating control to activate ‘Emergency Mode’ which highlights critical incidents and blocks non-essential edits
- For high availability, configure offline data caching for check-in device logs and safe sync patterns when mobile connectivity is intermittent
How to Use Natural Language Prompts to Create Sites
Codex Sites are designed to accept precise natural language prompts that describe data sources, UI components, and workflows. Below are practical guidelines and example prompts tailored to non-technical business users.
Prompt structure and components
Effective prompts include these elements:
- Intent statement: What problem the Site solves and who the users are (one short sentence).
- Data inputs: Which tables, sheets, or APIs the Site should use and any essential fields.
- Primary views and widgets: Which charts, tables, and controls are needed (KPI cards, line charts, Kanban, forms).
- Interactions: Important behaviors (drag-and-drop, export, save scenario, notifications).
- Security constraints: Any role-based visibility, data redaction, or read-only modes.
- Acceptance criteria: How to validate the Site works correctly (e.g., “export CSV matches the table”).
Why each component matters (detailed analysis)
Each element of the prompt maps directly to concrete configuration settings in Codex Sites. The intent statement lets the generator select a default layout and navigation model; data inputs constrain the schema and query patterns that will be built; widget specifications determine client-side rendering and chart libraries; interaction descriptions produce event handlers, API endpoints, and optimistic UI behavior; security constraints generate the access control lists (ACLs) and conditional rendering rules; acceptance criteria create the automated test assertions or smoke tests Codex can attach.
Without explicit data inputs, the system will infer types and may make incorrect assumptions about keys, time-series aggregation, and expected cardinality; specifying primary keys and a small example row reduces ambiguity and accelerates correct generation.
Prompt examples for non-technical users (expanded)
Short, copy/paste-ready prompts and extended templates that business users can adapt by replacing placeholders.
- Short version for quick creation:
"Build a Project Board that shows tasks by status with a burn-down chart. Connect to the 'sprint_tasks' table with fields: id, title, status, assignee, estimate_hours, remaining_hours, sprint_id."
- Detailed launch prompt (example):
"Create a Product Launch Hub for Marketing and PMs. Data: launch_milestones.csv (id,name,status,owner,due_date,priority) and messaging_templates.csv (id,channel,subject,body). Views: milestones Kanban grouped by status, messaging preview with templating variables, decision register table with create/edit. Interactions: drag milestones, preview rendered message with sample tokens, lock publish actions to 'Launch Owner' role. Acceptance: moving a milestone updates status in launch_milestones.csv, message preview substitutes variables from a selected milestone, and creating a decision inserts a record into decision_register with timestamp and user_id."
- Data-first prompt:
"Use Google Sheet 'CustomerFeedback June 2026' and create a Customer Review Workspace summarizing top themes and sentiment. Data fields: feedback_id, created_at, product_area, region, rating, text. Views: sentiment KPI (avg rating, % negative), top 10 themes by frequency, table of raw feedback with text highlight. Add filters for product_area and region and export for top-3 themes. Acceptance: sentiment KPI equals computed average rating from the sheet and export contains the same records as the filtered table."
- Finance scenario prompt:
"Build a Cash Flow Monitor for Finance Directors. Data: payments API endpoint (GET /payments) returning id, date, amount, counterparty, status, ledger_account. Views: daily inflow/outflow line chart, sliding window forecast card that projects 30 days using simple moving average of last 90 days, transaction table with search and export. Interactions: allow manual adjustment to forecast via a 'scenario' form that saves to ledger_scenarios table. Security: scenario save only for role 'Finance'. Acceptance: forecast calculation reproducible in CSV export and scenario saves create a ledger_scenarios row with JSON params."
Prompt templates for common enterprise roles
Below are templates business users can adapt by substituting dataset names and fields. Each includes acceptance criteria to reduce iteration cycles.
- Sales Manager:
"Create a Sales Pipeline Dashboard for Sales Managers. Data: opportunities table (opportunity_id, stage, owner, expected_close_date, amount, region). Views: pipeline funnel, opportunities table, owner leaderboard, calendar of expected_close_date. Interactions: move stage with drag-and-drop, bulk assign owner, export filtered list. Security: restrict revenue column to 'Sales Leadership'. Acceptance: moving a stage updates stage in opportunities table; revenue column hidden for non-leadership users."
- HR Lead:
"Build a Hiring Tracker for HR Partners. Data: candidates.csv (id,name,role,stage,recruiter,score). Views: Kanban by stage, candidate score histogram, candidate detail with resume link and comments. Interactions: change stage, add private notes, notify recruiter on offer stage. Security: private notes visible only to HR group. Acceptance: notifications trigger an entry in notifications_log and private notes save as redacted for non-HR users."
Short vs. detailed prompt trade-offs
| Prompt Type | Time to First Draft | Accuracy of UI/Behavior | Need for Iteration |
|---|---|---|---|
| Short (one-liners) | Fast (minutes) | Lower — more assumptions | High — expect several refinements |
| Detailed (schema, interactions, acceptance) | Slower (tens of minutes) | High — closer to production intent | Low — fewer cycles, but each takes longer |
Refining prompts during development (expanded)
When Codex first generates a Site, most business teams will want to iterate. Use incremental refinement prompts that are scoped to a single change to minimize regression risk. Structure iterations as: (1) describe the change, (2) name the affected components, (3) state the security and acceptance test.
- “Add a regional dropdown filter that defaults to ‘EMEA’ and persist the user’s choice across sessions. Affects: global filters bar and query parameters for all tables. Acceptance: after selecting ‘EMEA’, reload should keep filter and filtered API calls show region=EMEA.”
- “Replace the table’s ‘owner’ column with a small avatar and allow inline reassignment via dropdown of workspace members. Affects: opportunities table row renderer and update endpoint. Acceptance: selecting a new owner issues PUT /opportunities/:id and updates UI within 2s.”
- “Make the ‘Commit Scenario’ button only available to users in the ‘Finance’ group. Affects: action bar and scenario save endpoint ACL. Acceptance: users outside ‘Finance’ cannot see or call the commit endpoint; commit logs show user_id and role.”
Debugging and iteration prompts
Use these prompts when the generated Site doesn’t match expectations or returns errors:
- “Run a validation check and list any missing fields or type mismatches between the declared schema and the data source.”
- “Generate a detailed error log for the last 10 failed API calls with timestamps and response codes.”
- “Create a test dataset of 50 rows that exercise edge cases: null dates, negative amounts, extremely long text, and out-of-range enum values.”
Testing, validation, and acceptance criteria (practical)
Always convert high-level acceptance criteria into verifiable checks. Codex Sites can attach automated smoke tests if you provide explicit expectations. Examples:
- “Acceptance: export CSV when filter ‘region=APAC’ applied contains exactly the rows from the payments API with region==APAC and identical amount values.”
- “Acceptance: the forecast card shows a 95% confidence interval when using historical volatility >0.1; verify by checking forecast_stats.confidence_interval_exists==true.”
- “Acceptance: role-based redaction replaces PII fields with ‘REDACTED’ for users without ‘PII_ACCESS’ permission; verify by requesting the row as a low-privilege test user.”
Performance and scaling considerations
Natural language prompts simplify UI creation but large datasets and complex aggregations require operational safeguards. Recommended practices:
- Push heavy aggregation to source systems or to a middleware API instead of client-side rendering for datasets >50k rows.
- Use sampling or pre-aggregated tables for exploratory views; for example, provide a daily summary table that reduces query cost by 99% compared with raw scans.
- Limit prompt size and context; keep the natural language description focused and provide explicit schema rather than pasting large datasets into the prompt. Aim to keep prompt+example rows under 2,000–4,000 tokens for predictable latency with large models.
- Cache common queries for 1–5 minutes depending on volatility to reduce API costs and improve perceived responsiveness.
Security, governance, and recommended policies
When crafting prompts, include governance directives to prevent accidental exposure. Examples and recommendations:
- Include: “Mask columns ssn, email, and phone for all non-admins” rather than relying on default behavior.
- Specify: “Audit every write operation to audit_logs table with user_id, timestamp, action, and diff” to facilitate compliance and troubleshooting.
- For sensitive datasets, require: “All queries must be routed through server-side API with row-level security enforced; the client receives only rendered deltas.”
Expert insights and professional recommendations
Start with a focused Minimum Viable Site: define two or three core views and exact acceptance tests. This reduces ambiguity and typically lowers time-to-use by an order of magnitude compared with open-ended prompts.
For teams adopting Codex Sites broadly, create a library of validated prompt templates and share them across the organization; this creates consistency and reduces iteration. Track which templates produce high-quality outputs and version them with metadata: owner, last-updated, required datasets, and acceptance tests.
Finally, combine prompt-based generation with lightweight human review checkpoints for security, data quality, and UX accessibility; the combination of fast iteration and human governance yields reliable, production-ready sites more quickly than code-first processes.
How to Iterate and Refine Sites Using Annotations
Annotations are an essential mechanism for iterative refinement. They allow you to attach textual instructions, example inputs, or test cases directly to components of a Site. Use annotations to communicate design decisions, business logic, and acceptance tests to the Codex model and to colleagues who will review the Site.
Annotation types and use cases
- UI annotation: Explain how a widget should behave. Example: annotate a chart with “show product filters above the legend and highlight the currently selected series in bold.” Use UI annotations to define placement, visibility rules, responsive behavior and ARIA/accessibility guidance.
- Data annotation: Explain calculation rules. Example: annotate KPI card “ARR today = sum(active_subscriptions.arr) where end_date is null.” Data annotations define aggregation logic, join keys, date-window semantics, null handling and rounding rules.
- Test annotation: Provide expected outputs for known inputs. Example: “If bookings include account ACME with $120k ARR and pipeline conversion modifier = 100%, ARR forecast should include ACME’s pipeline contributions.” Use test annotations to create reproducible unit-test style checks and edge-case test vectors.
- Security annotation: Mark fields that require masking. Example: “Mask columns email, phone, and ssn in all exports.” Security annotations also identify PII, encryption-at-rest requirements, and column-level redaction policies.
- Performance annotation: Specify SLAs and query limits. Example: “Chart load must complete within 800ms on 95th percentile with dataset <= 500k rows; prefer pre-aggregated view 'sales_by_day'." Performance annotations guide model choices between live queries and precomputed materialized views.
- Access-control annotation: Define row- or column-level access. Example: “Only account managers with role ‘AM’ can view revenue columns for accounts with ARR > $100k.” Use these for RBAC enforcement and auditability.
- I18n/localization annotation: Specify locale formatting and translations. Example: “Show currency in EUR for region ‘EU’ and use long date format ‘DD MMM YYYY’ for fr-FR users.”
Annotation granularity: when to annotate a component vs. the Site
Annotations can be applied at multiple scopes — component, page, or Site-level. Component-level annotations are precise and ideal for acceptance tests or UI tweaks. Page-level annotations capture cross-widget interactions (for example, filter chaining and drill-down behavior). Site-level annotations define global policies (security, default locale, canonical data sources).
| Scope | When to use | Pros | Cons |
|---|---|---|---|
| Component | Specific behavior, tests, or formatting | Precise, fast feedback loop, easier to test | Can proliferate and create annotation noise |
| Page | Cross-widget interactions and layout rules | Captures dependencies and sequencing | Less reusable across pages |
| Site | Global policies, security, data source canonicalization | Single place for company-wide decisions | Can be too coarse for detailed acceptance criteria |
Practical annotation workflow — expanded
- Select the component in edit mode and add an annotation; include an objective, example input, and expected output whenever possible.
- Use machine-readable metadata in the annotation (see JSON example below) so the Codex generator can programmatically prioritize and resolve annotations.
- Ask Codex to “Apply the annotations” with an explicit prompt that lists the priority order and conflict rules (example prompts are provided later).
- Run the generated Site in preview mode and execute annotation-backed tests — either manually or via the automated test harness that Codex can generate from Test annotations.
- If the change is not exact, annotate the mismatch: reference the original annotation ID, explain the deviation, and supply a counterexample or delta acceptance criteria.
- Repeat until the annotation is marked accepted; once accepted, transition the annotation status to “closed” and capture the baseline snapshot for audit and rollback.
Annotation metadata and a recommended JSON schema
Store annotations in a structured format to enable programmatic workflows. A compact schema reduces ambiguity and speeds automated processing. Example:
{
  "id": "ANNOT-034",
  "type": "data",
  "component": "kpi-arr-card",
  "author": "[email protected]",
  "created_at": "2026-05-12T14:23:00Z",
  "priority": "P1",
  "status": "open",
  "acceptance_criteria": "ARR = SUM(arr) for accounts where status = 'active' and account_type != 'trial'",
  "example_input": [{"account_id":"ACME","arr":120000,"status":"active","account_type":"standard"}],
  "expected_output": {"kpi_value":120000},
  "linked_issue": "JIRA-4721",
  "severity": "high"
}
Keeping the above fields enforces repeatability and makes it straightforward to automate test generation, traceability, and audits.
Prompt templates for interacting with Codex
Use these concise, consistent prompts when asking Codex to act on annotations:
"Apply annotations: prioritize P1 then P2. Resolve conflicts by respecting security annotations first, then data, then UI. Return a diff of changes and a list of failed acceptance tests with failure reasons."
"Generate test harness from Test annotations for component 'bookings-table'. Produce 3 unit tests covering normal case, null values, and max-row-size performance with sample payloads."
"List unresolved annotations for site 'Executive Dashboard' grouped by component and priority. Output CSV with columns: id, type, component, status, author, created_at, acceptance_criteria."
Automating enforcement and CI integration
Annotations should feed into your CI/CD pipeline to prevent regressions. Recommended steps:
- Annotation Linter: fail builds if required fields (id, status, acceptance_criteria) are missing.
- Test Generator: translate Test annotations into executable tests (e.g., Jest, pytest) and run them on preview deployments.
- Gate Deployments: block production merges if any P1 security or data annotations are open or failing tests.
- Audit Log Export: snapshot closed annotations and diffs for compliance; retain for a minimum of 1 year to satisfy most regulatory audits.
Best practices and expert recommendations
- Be explicit about acceptance criteria. A one-line objective is a goal; an acceptance criterion with sample input/output makes it testable.
- Use IDs and statuses consistently. Adopt a convention like ANNOT-000 and statuses {open, in-review, accepted, closed} for traceability.
- Prioritize security and data annotations. When conflicts exist, security and PII rules must override cosmetic UI requests.
- Limit annotation density per component. Prefer fewer, high-quality annotations. Too many micro-annotations increase cognitive load and slow automated resolution.
- Annotate examples for edge cases. Include negative tests (nulls, empty arrays, extreme values). This reduces “works on sample, fails in prod” issues.
- Record performance targets numerically. Give SLAs (e.g., 95th-percentile load time <= 800ms) rather than ambiguous terms like "fast."
Common pitfalls and how to avoid them
- Vague language. Replace “make it faster” with “render in < 800ms for 95th percentile on dataset ≤ 500k rows."
- Conflicting annotations. Use priority fields and conflict-resolution rules; when ambiguous, prompt Codex to require human confirmation.
- Lack of traceability. Always link annotations to an external ticket or owner so responsibility is clear.
Versioning and review
Use annotations as the basis for a lightweight code review: reviewers can add comments, mark annotations as accepted or request changes, and sign off. Maintain a simple annotation convention like ANNOT-001, ANNOT-002 for traceability. For mature teams, enforce the lifecycle via automation: annotate -> generate tests -> run CI -> review diffs -> accept and close. Keep an annual or per-release export of closed annotations and diffs for compliance and retrospective analysis.
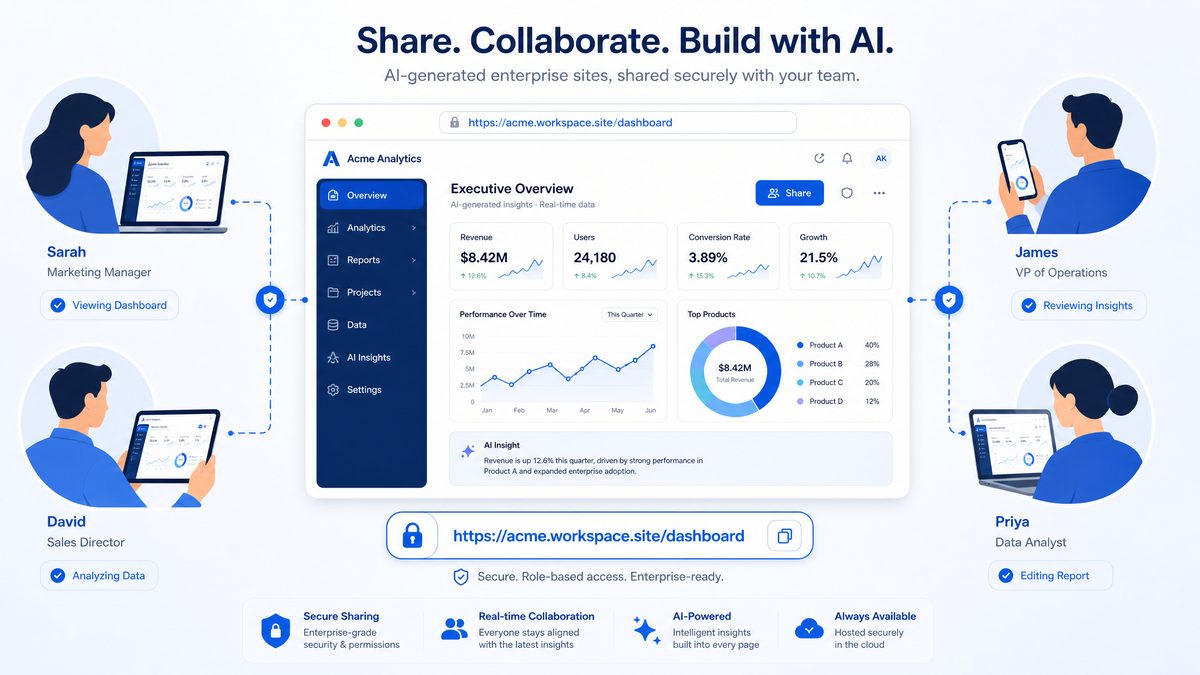
Sharing Sites with Workspace Members via URL
Published Codex Sites are shared by workspace URL. The sharing workflow typically offers granular visibility controls and an option to restrict access to workspace members or specific groups. Use these patterns when distributing Sites inside your organization to balance accessibility with data protection, delegation of editing rights, and auditability.
Share modes and how to choose
Choosing the right share mode depends on three factors: the sensitivity of the data, the audience’s authentication status, and the required level of interactivity (view-only vs. editable). Consider least-privilege principles: start restrictive and only broaden access when there is a clear business need.
- Workspace-only: Only authenticated workspace members can access the Site. Use for internal dashboards with sensitive data or PHI/PCI-equivalent information. Recommended when you want centralized SSO enforcement and complete audit trails.
- Group-restricted: Limit access to one or more SSO groups or workspace roles (e.g., Finance, PMs, Event Ops). Use for role-based content (e.g., financial forecasts) so viewers only see data relevant to their responsibilities.
- Public (token-based or time-limited): Provide a public link for a non-sensitive dashboard or for external stakeholders; combine with token-based or expiration settings if needed. Use only for aggregated, anonymized, or marketing data where long-term confidentiality is not required.
Comparison of share modes
| Mode | Typical Use Case | Security Profile | Recommended Expiry / Settings |
|---|---|---|---|
| Workspace-only | Internal ops dashboards, HR metrics, product telemetry | High — enforced SSO, audit logs required | No expiry; use session timeouts 15–60 min, MFA recommended |
| Group-restricted | Finance forecasts, Sales territory dashboards, Support queues | Medium-high — role mapping + RLS (row-level security) advised | Group membership sync frequency: daily; limit commit rights to editors |
| Public (token-based/time-limited) | Executive summaries for partners, conference demos, press stats | Low — treat as publicly accessible; avoid exporting sensitive tables | Token TTL: 24–72 hours for temporary access; maximum 7 days for low-risk data |
Step-by-step sharing (detailed)
- From the Site editor, click Publish or Share. Confirm the Site build completes without unresolved data binding errors — unresolved datasource errors can cause broken widgets for viewers.
- Choose access mode (Workspace-only by default). If group-restricted, select SSO groups or workspace roles. Map groups precisely: use your identity provider’s group IDs where possible rather than free-text names to avoid drift.
- For group-restricted Sites, configure editor vs viewer roles. Typical pattern: Editors = Grant “Commit Scenario” and “Edit” permissions; Viewers = Read-only, with export disabled. Use separate groups like “Finance-Editors” and “Finance-Viewers”.
- Optionally enable download or export controls. For sensitive Sites, disable exports to CSV or PDF. If exports are required, use watermarking and require a “reason” capture on each export (captured in audit logs).
- If you select a public token-based link, set expiry (recommended 24–72 hours). Prefer signed URLs (HMAC) with expiry and verifiable issuer fields; avoid long-lived tokens embedded in documentation.
- Copy the workspace URL and paste into the communication channel (e.g., Slack or an internal wiki). The URL will require authentication according to your selected access mode. When posting externally, remind recipients tokens must not be re-shared.
- Monitor access via Site analytics or audit logs to see unique visitors, actions performed (e.g., exports, scenario commits), and errors. Set alerts for anomalous patterns (see Monitoring section below).
Security and access-control technical details
Understand the underlying mechanisms so you can anticipate attack surfaces and operational limits:
- SSO Group Mapping: Synchronize groups from your IdP (Okta, Azure AD, Google Workspace) using group IDs. Plan for group sync delays: implement retry logic or a manual sync trigger for urgent access changes.
- Token-based Links: Use signed URLs with an expiry (e.g., URL?token=eyJhbGci…). Prefer server-generated short-lived tokens to client-generated tokens. Never embed long-lived API keys in public links.
- Referrer and leak mitigation: Public or tokenized URLs can leak via referer headers. Use referrer-policy: no-referrer-when-downgrade or no-referrer, and recommend Content-Security-Policy and X-Frame-Options to prevent clickjacking and unintended framing.
- Row-level Security (RLS): Apply RLS at the data-source layer when group-restricted Sites display sensitive subsets. For example: Sales reps should only see accounts assigned to them — enforce this with datasource filters keyed to user_id.
- Session and Token Lifetimes: Recommended session idle timeout 15–60 minutes depending on sensitivity. Token TTLs: 24–72 hours for temporary access, never exceed 7 days for non-critical content.
Audit logging and monitoring
Audit logs and analytics are central to proving compliance and detecting compromise. Collect structured logs and maintain retention aligned to policy (e.g., 90–365 days).
Essential audit fields to capture for every Site access event:
- timestamp (ISO 8601)
- user_id and workspace_id
- action (view, edit, export, commit_scenario)
- resource_id (site_id, widget_id)
- ip_address and geo (where available)
- user_agent
- outcome (success/failure and error codes)
- reason/comment for sensitive operations (e.g., export justification)
Recommended monitoring rules and thresholds:
- Alert when exports for a single Site exceed baseline by >5x within a 24-hour window.
- Alert on >10 failed authentication attempts to a Site within 15 minutes from the same IP block.
- Alert when a public token is accessed from multiple distinct countries within a short period (possible token leakage).
Practical prompt templates and messaging examples
Use these templates for rapid sharing, release notes, or automation in CI/CD triggering a Site publish.
Admin publish command (example):
"Publish Site: 'Revenue Forecast Planner'
- Access: Group-restricted
- Groups: Finance-Viewers (view only), Finance-Editors (edit & commit)
- Exports: CSV disabled for viewers; enabled for Finance-Editors with watermark
- Token: none
- Notify: #finance-ops Slack channel"
Temporary external access message (for partners):
"Shared 'Q2 Partner Dashboard' via time-limited token:
- URL: https://codex.example.com/site/partner-q2?token=...
- Expires: 48 hours from grant
- Allowed actions: View-only, no downloads
- Contact: [email protected] for issues"
Example release-note snippet:
"Deployed 'GTM Territory Performance' to Workspace-only. Audience restricted to 'GTM' SSO group. Editors = 'GTM-Managers' (commit enabled). Exports disabled. Audit logs enabled with 180-day retention."
Expert recommendations
- Adopt a publish checklist: data source health, row-level security, group mapping verification, export settings, and audit logging check before each publish.
- Run quarterly access reviews: verify group membership and remove stale viewers to reduce risk exposure.
- Prefer immutable public snapshots for external sharing (periodic exports or embedded images) rather than live dashboards when data sensitivity or auditing is a concern.
- Automate Site publish via CI/CD pipelines when Sites are part of reproducible reports; include an automated smoke test that validates rendering and datasource queries post-publish.
Keeping Sites Updated as Data Changes
Operational durability for Sites requires mechanisms to keep data fresh and to ensure UI components adapt to schema changes. This section lists practical approaches to maintain Sites over time and gives concrete examples, monitoring techniques, and change-management templates so your interactive enterprise dashboards remain reliable as the underlying data evolves.
Data refresh strategies — detailed trade-offs and SLAs
Choosing a refresh strategy means balancing latency, cost, complexity, and load on source systems. Below are detailed recommendations, practical SLAs, and typical implementation patterns for each approach.
| Strategy | Typical latency | Cost & Load | Complexity | Best use cases |
|---|---|---|---|---|
| Direct live connections | Sub-second to seconds (query-time) | Higher read load on DB; needs read-replicas or caching | Medium — connection config, query optimization | Operational dashboards, SLA-sensitive KPIs, executive real‑time views |
| Scheduled refresh | Minutes to hours (15 min, hourly, nightly) | Predictable; can batch to reduce cost | Low to medium — scheduler + ETL management | Reports that tolerate lag (finance close, daily ops reports) |
| Event-driven updates | Seconds to minutes | Moderate; more network events but smaller incremental loads | High — event plumbing, deduplication, idempotency | Alerting dashboards, inventory levels, streaming metrics |
| Hybrid (cache + live) | Configurable (cache TTL) | Optimized; reduces direct load | Medium — caching layer + invalidation | High-traffic public dashboards, BI with occasional spikes |
Recommended SLA examples to set with business stakeholders:
- Near real‑time KPIs: RPO ≤ 1 minute, target cache TTL 30s, monitor 95th percentile query latency < 500ms.
- Operational dashboards: RPO ≤ 15 minutes, schedule refresh every 5–15 minutes during business hours.
- Strategic reports: RPO ≤ 24 hours, nightly ETL with full reconciliation checks.
Implementation examples:
- Direct live: connect Sites to a read-replica of your OLTP DB or to a cloud warehouse (e.g., Snowflake reader account) and enforce query timeouts and resource monitors to protect production.
- Scheduled: use Airflow/Cron to refresh materialized views or export CSVs; attach a “last refreshed” timestamp and a row-count delta on the top-level card.
- Event-driven: configure your ETL to emit a webhook (payload example below) that hits an authenticated Site refresh endpoint to invalidate caches and re-run incremental queries.
Example webhook payload (escaped for HTML):
<json>{“event”:”pipeline_snapshot”,”dataset”:”orders_v2″,”rows_added”:124,”snapshot_time”:”2026-06-01T12:34:56Z”,”signature”:”sha256:…”}</json>
Schema evolution and resilience — patterns and code-level practices
Data models change. Adopt multiple defensive layers so a rename or type change doesn’t break dozens of dashboards.
- Column mapping layer / canonical view: Create a stable named view that renames and coerces types to a predictable contract. Update only the view when the source schema changes instead of every Site.
- Example canonical view pattern: Maintain a view called site_contract.orders_v1 that exposes fields like order_id, customer_id, amount_usd. The view maps from current source names and uses COALESCE and SAFE_CAST to enforce types.
- Fail-safe defaults and graceful degradation: In formulas and visualizations, use COALESCE(…, 0) or default labels like “field unavailable”. Display a non-blocking banner when a required measure is missing instead of a hard error.
- Contract testing / schema checks: Add automated checks in CI to validate that required fields exist and have expected types. Fail PRs that change the contract without providing a migration plan.
- Versioned datasets: When making breaking changes, publish a new version of the dataset (orders_v2) and maintain v1 for a deprecation period (e.g., 90 days) while notifying Site owners.
Example SQL snippet for a resilient view (conceptual):
SQL: SELECT id AS order_id, COALESCE(TRY_CAST(amount AS FLOAT), 0.0) AS amount_usd, created_at FROM raw.orders_source;
Monitoring and alerting — which metrics to track
Embed operational telemetry into your Sites and your data pipelines. Key metrics to capture include:
- Data freshness: age of newest row, last refresh timestamp, percentage of data within SLA.
- Query performance: 95th and 99th percentile latency, rate of timeouts, average CPU/IO per query.
- Schema drift: number of missing/extra columns vs. contract, data-type mismatches.
- Data quality: null rate for critical fields, row counts vs. expected ranges, duplicate keys.
- Error rates: failed refreshes per day, failed webhook deliveries, ETL job failures.
Set concrete alert thresholds. Example SLOs:
- Less than 1% of refresh jobs fail per week.
- Data freshness breach (age > SLA) should trigger P1 if it affects executive dashboards during business hours.
- Schema drift detection should create a ticket within 15 minutes to the Data Engineering on-call.
Testing, staging and rollout patterns
Treat Sites like software. Use staging environments, synthetic data, and canary releases:
- Staging Sites: Mirror production connectors against a read-only dataset with anonymized or synthetic data to validate new visualizations and schema changes.
- Synthetic test datasets: Create controlled datasets that exercise edge cases (nulls, extreme values) so changes don’t produce surprising visuals.
- Canary / gradual rollout: Deploy new Site versions to a small set of users first, monitor key metrics (error rates, NPS), then roll out organization-wide.
Change management — communication templates and runbooks
Changes are inevitable. Define a repeatable process for notifying stakeholders, documenting actions, and rolling back when necessary.
| Task | Recommended cadence | Who | Why |
|---|---|---|---|
| Schema change notification | At least 48 hours before change | Data Engineering → Site owners | Allows owners to adjust queries and visuals |
| Dashboard QA | Weekly for volatile metrics; monthly for stable KPIs | Site owners + Analyst | Validate numbers and business logic |
| Post-change verification | Immediately after deploy | On-call + Site owner | Confirm no regressions; trigger rollback if needed |
Example notification template (short and actionable):
- Subject: Upcoming schema change: orders.amount → revenue_amount (planned 2026-06-10)
- Body: “Change: field rename and type change. Impact: dashboards using orders.amount will break. Action: update to orders.revenue_amount before 2026-06-10. Migration plan and fallback view: site_contract.orders_v1 will be maintained for 30 days. Contact: [email protected].”
Operational recommendations from experts
- Runbook first: Maintain a short runbook embedded inside the Site editors area with steps: identify the failing cards, verify the mapping view, roll back to previous dataset version, and notify stakeholders.
- Automate where possible: Use CI checks to prevent breaking changes, webhook retries with exponential backoff for event-driven updates, and automated rollbacks if quality gates fail after a deployment.
- Visibility beats perfection: Surface a small health module on every critical dashboard showing freshness, row count, and last schema check—users tolerate known stale data when the UI is transparent about it.
- Least privilege for connectors: Use service accounts scoped to read-only datasets or specific views; rotate credentials regularly and document expiry in the Site change log.
By combining solid refresh architecture, resilient schema practices, proactive monitoring, testing, and disciplined change management, Sites can remain reliable and informative even as data sources evolve rapidly. Operationalize these practices incrementally: start with canonical views and health widgets, then expand to automated alerts and CI-based contract testing.
Partner Integrations: Connectors, Hosting, and Design Tools
Codex Sites can be integrated with external services for hosting exports, continuous editing, design handoff, and extended functionality. Below is a quick reference that compares common partner categories and specific vendors you may use.
| Partner | Primary use | Integration pattern | When to use |
|---|---|---|---|
| Vercel | Deployment & static hosting | Export static Site assets or integrate via Vercel’s API for continuous deployment | When you need public-facing, high-performance hosting or to export a Site as a standalone app |
| Wix | Designer-friendly site embedding | Embed widget or iframe; use Wix APIs for authentication | When marketing teams want to embed interactive widgets into a marketing microsite |
| Base44 | Data connectors & ETL (example data platform) | Connector that syncs data into a staging schema or data lake for Sites | When you need a managed connector to many enterprise systems |
| Replit | Collaborative code editing | Hand off Site export for developer edits in a live coding environment | When developers need to extend the Site with custom code |
| Lovable | Feature experimentation & A/B testing | Integrate via experiment toggles and event tracking SDK | When you want to A/B test different UI flows and measure engagement |
| Figma | Design handoff & prototypes | Export design tokens and frames; use Figma API for assets | When product designers want pixel-accurate handoff to Sites |
| Webflow | Visual site building and CMS | Embed Sites or export HTML/CSS for designer-managed pages | When marketers or designers need control over layout and styles |
| Emergent | Monitoring & observability (example partner) | Send logs and telemetry to Emergent for uptime and performance alerts | When Sites must meet SLA and performance monitoring |
Integration patterns and steps with representative partners:
Why integration strategy matters: push vs. pull, embedding vs. exporting
Deciding between embedding a live Codex Site (iframe or JS widget), exporting static assets to a host, or mounting a two-way connector depends on latency, security, and control requirements. Embeds keep the runtime under Codex control and minimize export friction, but increase cross-domain complexity (CORS, postMessage patterns) and may require tokenized session passes for auth. Exports to Vercel/Webflow shift runtime responsibility to the host and give greater control over performance, caching, and custom server logic, but require CI/CD and provenance controls. Data connectors (Base44-style ETL) create copies of production data in a staging schema; use them when you need fast queries, offline transformations, or to apply governance filters before presenting data in a Site.
Comparison: Integration attributes and risk profile
| Attribute | Embed (iframe/widget) | Export (static + serverless) | Connector (ETL / data sync) |
|---|---|---|---|
| Control over runtime | Low (Codex runtime) | High (your infra) | Medium (managed staging) |
| Latency characteristics | Dependent on Codex CDN | Deterministic with host CDN | Dependent on sync frequency |
| Data movement risk | Minimal (live queries) | High (assets & possibly data exports) | High (data copied to third party) |
| Recommended for | Marketing embeds, internal dashboards with SSO | Public apps, white-labeled dashboards | Enterprise integrations, analytics back-ends |
Vercel: Export and Host a Public-Facing Version (detailed)
- From the Site editor, select Export & Deploy → choose Vercel; provide a scoped service token rather than a personal token to follow least privilege principles.
- Codex generates static pages and a minimal serverless layer for dynamic endpoints; it produces a deployment package and triggers Vercel’s REST API for a build. Typical API endpoint: POST https://api.vercel.com/v13/deployments with a JSON payload including env vars and git metadata.
- Set Cache-Control headers: for dashboard assets with frequent updates, use s-maxage=60, stale-while-revalidate=300 to balance freshness and CDN efficiency; for static shells, s-maxage=86400 is appropriate.
- Enable custom domain and TLS at the host; ensure DNS TTLs are low during initial rollouts to speed up rollback.
- Recommended operational checks: synthetic load test targeting 10 RPS per dashboard tile to validate function cold starts, and set alert thresholds for 95th percentile latency (e.g., 500–800 ms) and error rate >0.5%.
Figma: Design-driven refinement and token mapping
Codex can import design tokens from Figma to preserve brand fidelity; success rate increases when designers follow a token-first approach. Export a JSON of tokens and provide mapping instructions to Codex using a short, explicit table:
| Figma token | CSS variable | Usage |
|---|---|---|
| Primary / Brand / Blue 500 | –color-primary: #0057D9 | Primary buttons, links, focus states |
| Spacing / Scale / 8 | –space-8: 8px | Grid gutters, component padding |
| Type / Heading / H1 | –font-h1: ‘Inter’, 600, 32px | H1 titles across pages |
Prompt template for Codex when importing Figma tokens:
- “Import the following Figma token JSON and map ‘Brand/Primary’ to CSS variable –color-primary. Replace button.primary background with –color-primary and ensure accessible contrast 4.5:1.”
- Include an accessibility pass: “Generate CSS and accessible states for focus, hover, and disabled states for each token; run contrast checks and list any tokens that fail WCAG AA.”
Replit and Webflow: Developer and designer handoff patterns
Use Replit for rapid, collaborative developer edits; it supports live coding, previewing, and CI hooks. A practical flow:
- Export the Site bundle to a new Replit project; include a README with environment variable templates and a .env.example file listing required secrets (e.g., DATA_READONLY_KEY, AUTH_JWT_SECRET).
- Implement custom server logic (role-based authorization, server-side caching) in a designated serverless function folder; run local smoke tests and unit tests pre-commit.
- For Webflow, export static markup and CSS for marketing pages; use Webflow’s class system to map design tokens and maintain a shared styleguide to reduce drift between design and production.
- When switching from export to continuous delivery, adopt a git-based workflow with protected branches and automated preview deployments to guard production stability.
Data connectors and ETL (Base44 example): practical details
When syncing enterprise systems into Codex Sites analytics or dashboards, follow these best practices:
- Use incremental replication with a high-watermark column (e.g., modified_at) to minimize load and achieve near-real-time freshness; aim for latency SLAs such as <5 minutes for operational dashboards and <24 hours for analytical snapshots.
- Perform schema validation and column-level classification during ingestion (PII, sensitive, numeric) and apply masking rules for PII before committing to staging.
- Store sync metadata (last_sync_at, rows_synced, error_count) in a control table for observability and retry logic.
- Example transformation: run an upsert keyed by a canonical id to ensure idempotency; if source systems lack stable ids, synthesize a composite key and log provenance.
Experimentation and observability: Lovable & Emergent
Integrate feature flagging (Lovable) to decouple rollout from deployment; use event SDKs on the Site to record exposure events, impression times, and conversions. Recommended metrics to capture:
- Exposure rate, conversion rate per variant, time-to-first-interaction, and retention over 7/14/30 days for dashboards.
- Use Emergent or equivalent for tracing and logs: sample traces at 5–10% for production to keep costs down while capturing tail latency; set alerts for 99th percentile response time and error budget burn rates.
Security, compliance, and governance
Before connecting production data to any third-party partner, confirm SOC 2 Type II or equivalent, data residency options (EU-only processing if required), contractual terms for data deletion, and support for SSO/SCIM for user provisioning. Technical controls: use short-lived tokens (rotate every 24–72 hours where possible), enforce IP allowlists for API calls, and enable logging with tamper-resistant storage to support audits.
Quick prompt templates for common tasks
- Figma mapping: “Map the Figma design tokens in this JSON to CSS variables and produce a token stylesheet. Highlight any token that fails WCAG AA contrast.”
- ETL job spec: “Create an incremental sync plan from Salesforce to the staging schema ‘sf_contacts’, with modified_at watermark, daily full reconciliation, and a column-level mask for email and phone.”
- Deploy script for Vercel: “Generate a curl-based deployment example that posts a zipped site bundle to Vercel’s deployments endpoint and sets env vars for AUTH_JWT_SECRET and DATA_API_URL.”
Expert recommendation summary: prefer embeds for low-friction internal demos, exports to managed hosts for public, high-performance apps, and managed connectors when governance and auditability are the priority. Always codify token and secret handling, run synthetic and real-user monitoring, and stage integrations behind feature flags before full rollouts.
Best Practices for Enterprise Dashboard Design with Codex
Designing effective dashboards is both an art and a discipline. The Codex Sites platform enables rapid iteration, but sensible design choices ensure dashboards are actionable and trusted. Below are expanded, pragmatic guidelines—technical, design and governance—aimed at helping teams deploy high-value dashboards that scale across users, data volumes, and regulatory requirements.
Core design principles (expanded)
- Purpose-first: Every dashboard must answer a small set of well-defined questions (e.g., “Will we hit target ARR this quarter?”). If a widget does not support a decision, remove or relocate it. A practical rule: no dashboard should attempt to answer more than three questions at a glance; supporting exploration is fine, but primary view = decisions.
- Single source of truth: Connect dashboards to canonical data sources and document lineage in metadata (table name, ETL job, transformation ID, refresh cadence). Track provenance with fields such as source_table, etl_job, and last_success stored as dashboard metadata. This reduces KPI drift; organizations that enforce single-source policies report 20–40% fewer KPI disputes in decision meetings.
- Visibility by role: Provide context-appropriate views. Executives need top-line KPIs; individual contributors want task-level detail. Implement role-based rendering in Codex Sites using claim-based rules (e.g., user.role in [“exec”] shows executive layout). Keep filters and default time horizons aligned with roles—for example, executives default to MTD and QTD, operations default to last 7/30 days.
- Predictable interactions: Keep controls consistent across Sites. For example, filter panels should be on the left or top in every Site your organization builds. Define a small set of interaction patterns (single-select, multi-select, drill-down, inline-edit) and reuse them—this reduces training time by up to 50% in onboarding studies.
- Lightweight explanations: Include a short “How to read this dashboard” section and hover tooltips for non-obvious calculations. Use a standard tooltip template: metric definition, calculation pseudo-SQL, data freshness, and contact owner (e.g., “ARPU = sum(revenue)/active_users; last refresh: 2026-05-28; owner: [email protected]”).
Layout and widget rules (practical guidance)
- Limit the number of primary widgets visible without scrolling to 5–8 on desktop to reduce cognitive load. Empirical UX guidance shows comprehension declines when users must parse more than ~8 visual elements simultaneously.
- Position KPI cards at the top, charts in the center, and detailed tables lower down. This supports a “summary → trend → detail” reading pattern that matches most decision workflows.
- Use color sparingly and consistently (e.g., green for positive, red for negative, amber for attention) and avoid decorative colors for data. Adhere to WCAG contrast ratios: at least 4.5:1 for body text and 3:1 for large text to maintain accessibility.
- Prefer user-controlled time ranges (last 7/30/90 days) over hard-coded ranges unless the use-case requires a fixed period. For finance dashboards that drive compliance, include both a locked fiscal-period view and an exploratory sliding window.
Widget selection: comparison and recommended limits
| Widget type | Best for | Recommended data volume | Expected response time | Server-side recommendations |
|---|---|---|---|---|
| KPI cards | Top-line metrics and targets | Small (aggregates) | < 500ms | Pre-aggregate daily values; cache 1–15 min |
| Time series charts | Trends and seasonality | Moderate (hundreds to thousands of points) | 500ms–2s | Downsample for long ranges; materialized view for rolling windows |
| Heatmaps / Dense visuals | Capacity, performance hotspots | High (thousands to millions) | 1–5s | Pre-aggregate buckets; server-side binning |
| Tables / Raw rows | Operational troubleshooting | Small per-page (50–200) | <2s (paginated) | Server-side pagination; limit and offset or cursor-based |
Accessibility and performance (technical checklist)
- Ensure charts and tables are keyboard-navigable and support screen readers. Use ARIA roles (role=”table”, role=”columnheader”, aria-sort) and provide aria-describedby with metric definitions.
- Optimize queries for performance—avoid returning full raw transaction tables to the browser; aggregate server-side when possible. Example: transform SELECT * FROM transactions WHERE date > ‘2026-01-01’ into SELECT date_trunc(‘day’, date) day, sum(amount) total FROM transactions WHERE date > ‘2026-01-01’ GROUP BY 1.
- Aim for 60–90 second maximum user-configured queries (for ad-hoc large exports); for highly-interactive controls, target responses under 2 seconds via caching, pre-aggregation, or materialized views. Use async job patterns for heavy exports and notify users via email/webhook when ready.
- Use CDN and edge caching for static assets, and employ HTTP caching headers for JSON endpoints where freshness tolerance exists (e.g., cache-control: max-age=60 for KPIs).
Practical governance tips (expanded)
- Enforce a dashboard review process: owner, one technical reviewer (data engineer), and one business reviewer. Capture approvals in dashboard metadata and require sign-off for KPIs that feed executive reporting.
- Maintain a “retire” policy for stale dashboards—review dashboards that have not been updated or used in 90 days. Implement an automated email workflow that flags candidates with usage < 5 unique viewers/month for three consecutive months.
- Instrument dashboards with usage analytics: number of unique viewers, interactions per view, average dwell time, and export rate. Use thresholds to prioritize iterations; for example, dashboards with >1,000 weekly views and low engagement (<10 interactions per view) may need redesign.
- Standardize naming and tags: include prefix (team/function), environment (prod/stage), and sensitivity label (public/internal/confidential). Example: sales_kpis.prod.internal.
Operational and technical best practices
- Versioning and CI/CD: Keep dashboard definitions in source control. Treat dashboard changes like code—PRs, code reviews, automated schema checks, and staged deployments. Maintain a rollback snapshot for each release.
- Testing: Create unit tests for SQL/transformations (sample row counts, null checks, known sanity checks). Add visual smoke tests for key widgets (rendering and value sanity).
- Secrets and access: Avoid embedding credentials in Site code. Use a secrets manager and short-lived tokens for database connections. Enforce least-privilege queries—read-only accounts scoped to datasets.
- Data freshness SLAs: Define and surface refresh SLAs (e.g., “Data freshness: 15 minutes”) and alert on SLA violations to owners automatically.
Prompt templates and practical examples for Codex-driven workflows
Use these templates when working with Codex or LLM assistants to generate dashboard components, SQL, or metadata.
- Generate an aggregate SQL for a Top-line KPI
Prompt: "Create a SQL aggregate to compute monthly ARR for paid customers from table 'subscriptions' with columns (customer_id, plan_amount, start_date, status). Exclude cancelled subscriptions. Group by fiscal_month. Include column names: fiscal_month, monthly_arr. Use PostgreSQL." - Produce tooltip and metric definition
Prompt: "Write a concise tooltip for the KPI 'Customer Churn Rate' including: one-line definition, calculation pseudo-SQL, data source, refresh cadence, and owner email." - Role-based view rule
Prompt:
"Provide a JSON rule that shows the 'financials' dashboard only to users with role 'finance' or 'executive', and defaults time range to 'FYTD' for 'executive'. Use claims: user.role."
Expert recommendations
- Adopt a “one KPI, one table” mindset for critical metrics—store KPI pre-aggregates in a dedicated table (e.g., kpi_monthly.arr) that is updated by a deterministic ETL to reduce ambiguity and improve performance.
- Invest in a lightweight data catalog and tag KPIs with the ETL job, SLA, and owner. This reduces in-meeting disputes and accelerates incident response.
- Use feature flags for new dashboard features and roll them out to a pilot group (5–10% of users) before a full release; measure impact on latency and user behavior.
- Design for failure: provide graceful fallbacks for stale or failed queries (cached snapshot with timestamp and a clear “data delayed” banner) to maintain trust during incidents.
Security Considerations for Hosted Sites
Security is central for enterprise adoption. Codex Sites must be configured and operated with standard security best practices and additional platform-specific controls where available. The following expanded guidance covers concrete controls, operational processes, monitoring recommendations, and templates you can apply directly when designing, deploying, and operating Sites that expose dashboards or interactive analytics to internal and external stakeholders.
Identity and access control
Authentication and authorization are the first line of defense. Simply enabling SSO is not enough — you must define roles, lifecycle processes, and enforcement mechanisms.
- SSO and SCIM provisioning: Use SSO (SAML or OIDC) for user authentication and SCIM for group and attribute provisioning. Map SCIM attributes such as memberOf, department, and employeeType to Site roles so access reflects HR state. Automate deprovisioning to occur within your HR-to-IdP workflow; aim for deprovisioning within 15 minutes of termination where possible.
- Role definitions: Define at minimum three roles — Viewer (read-only), Editor (authoring, no publish), Publisher (can publish and update live Sites), and Administrator (manage connectors, secrets, and SSO). Represent these in a permissions matrix and review quarterly.
- Least privilege enforcement: Apply least privilege by default. Grant edit and publish permissions only to the smallest necessary set of users. For highly-sensitive Sites, restrict publishing to a change-control group and require an approval step in your CI/CD workflow.
- MFA and device posture: Require multi-factor authentication for all users with publisher or admin privileges. Enforce device-management policies for any user that accesses Sites containing regulated data — use device certificates or endpoint management checks (MDM/Intune) where available.
Practical IAM templates
Example role/permission matrix you can copy into internal policy documents:
| Role | Typical Permissions | Recommended Controls |
|---|---|---|
| Viewer | Read dashboards, export allowed only if not sensitive | Default role; no publish; limit CSV export for PII |
| Editor | Create & edit Sites, create queries, test connectors | Require scoped write tokens; periodic access reviews |
| Publisher | Publish Sites, schedule refreshes, manage versions | Require MFA, approval workflow for production publish |
| Administrator | Manage connectors, secrets, SSO, audit logs | Limit to operations team; separate privilege for secret creation |
Authentication options comparison
| Method | Use case | Security pros | Operational cons |
|---|---|---|---|
| SSO (SAML / OIDC) | Enterprise users, internal Sites | Centralized auth, supports MFA and conditional access | Requires IdP integration and SCIM mapping work |
| OAuth2 Client Credentials | Service-to-service connectors | Short-lived tokens, scoped permissions | Must rotate client secrets; complexity in token management |
| API Keys | External embed or automated scripts | Simple to implement for read-only use | Harder to revoke per-user; less fine-grained control |
Data protection
Protecting data both at rest and in motion is non-negotiable. Consider not only encryption, but also data minimization, masking, and auditability.
- Encryption: Verify TLS 1.2+ (prefer TLS 1.3) for all client-server and connector traffic. For data at rest, require AES-256 or equivalent (for example, AES-GCM 256). Ask your provider for key management details: are keys customer-managed (BYOK) or provider-managed? Customer-managed keys give stronger control and auditability.
- Scoped database credentials: Use read-only credentials bound to a reporting schema. For PostgreSQL, create a role with CONNECT on the reporting DB and SELECT only on specific schemas/tables. Example: CREATE ROLE codex_reporter NOINHERIT LOGIN PASSWORD ‘…’; GRANT CONNECT ON DATABASE reports TO codex_reporter; GRANT USAGE ON SCHEMA analytics TO codex_reporter; GRANT SELECT ON ALL TABLES IN SCHEMA analytics TO codex_reporter;
- Masking and PII management: Implement column-level masking for fields such as SSN, email, and phone numbers. Prefer masking at the source (views or UDFs) to avoid accidental exposure in dashboards. Block export of masked columns in the UI and add “redaction” banners to any exported artifacts.
- Export controls: Enforce file-format restrictions and watermarks. For regulated data, disable CSV/Excel exports and only allow image exports with embedded watermarks and audit stamps (user, time, dataset id).
Network and operational security
Network design for connectors determines your attack surface. Favor private paths and hardened operational controls.
- Private connectivity: Use VPC peering, private endpoints, or cloud connectors to avoid exposing databases to the public internet. VPC peering reduces attack surface and latency; private connectors are easier to manage for multi-cloud architectures.
- IP allowlists and egress controls: Configure IP allowlists for admin consoles and connector endpoints. Keep a minimal set of egress rules and log all cross-network traffic.
- Audit logging: Enable audit logging for Site activities including publishes, exports, authentication events, connector rotations, and permission changes. Forward logs to a centralized SIEM (Splunk, Elastic, SumoLogic) and keep tamper-evident storage with 1 year minimum retention for general data and longer for regulated workflows (3–7 years typical in finance/healthcare).
- Operational metrics: Monitor access patterns: unusual spike in exports, repetitive failed auth attempts, or repeated query patterns that suggest exfiltration. Set automated alerts for anomalous events and integrate with your SOAR/incident response playbooks.
Network connectivity comparison
| Connectivity | Typical Latency | Security | Complexity |
|---|---|---|---|
| Public internet w/ TLS | Variable | Good if TLS + IP allowlist, higher exposure | Low |
| VPC Peering / Private Link | Low | High — no public exposure | Medium — network ops changes required |
| Managed Private Connector | Low–Medium | High with simpler management | Medium |
Secrets management and credential rotation
Secrets are often the weakest link. Use enterprise-grade secret managers and automate rotations.
- Do not store plaintext: Never store API keys, database credentials, or private tokens in Site annotations, UI fields, or code repositories. Use workspace secret storage or external secret managers such as HashiCorp Vault, AWS Secrets Manager, or Azure Key Vault.
- Rotation cadence: Rotate service credentials at least quarterly. For high-risk connectors (production DBs, PII access), rotate monthly and enforce automatic rotation where supported. Short-lived tokens (minutes to hours) are preferable for service-to-service auth.
- Automate and audit rotations: Use automation (CI/CD pipelines or cloud functions) to update connectors after secret rotation and record the event in your audit log. Ensure rotations trigger smoke tests to validate connector connectivity.
Compliance, data residency, and third-party assessments
Regulated industries should validate provider controls and data flow. Ask specific questions and require evidence.
- Data residency: Confirm where customer data is stored and whether the platform supports region selection or local read-replicas. For EU GDPR, healthcare (HIPAA), or finance (PCI/DSS) workloads, require data-at-rest and processing within approved regions.
- Certifications and audits: Request SOC 2 Type II, ISO 27001, or relevant certifications. Review the scope of audits — do they cover the Site features and connector architecture you plan to use?
- Vendor risk: Include Codex Sites in your vendor risk assessment. Evaluate incident response SLAs, breach notification timelines (commonly 72 hours for serious incidents), and the provider’s support for data subject access requests (DSARs).
Monitoring, detection, and incident response
Prepare operationally for security incidents with documented playbooks and integrated tooling.
- SIEM integration: Centralize logs from authentication, connectors, publishing events, and exports into your SIEM. Retain logs per policy and enable immutable storage for any regulatory needs.
- Alerting: Create alerts for high-risk actions: new publisher added, connector credential change, mass export of records, or repeated failed logins. Use a thresholding approach to avoid alert fatigue—e.g., more than 100 exports in 1 hour triggers review.
- Incident playbooks: Draft clear steps for containment, eradication, and recovery. Include fast paths for revoking API keys, rotating DB credentials, disabling a Site, and notifying stakeholders. Practice quarterly tabletop exercises with the relevant teams.
Practical prompt templates and operational examples
Use these templates to accelerate operational tasks or vendor conversations.
- IAM Policy Request (to your IdP admin):
<strong>Template:</strong> "Provision group 'codex-publishers' with SAML attribute 'employeeType=contractor:false' and SCIM mapping to role 'Publisher' in Codex Sites. Enforce MFA and conditional access requiring corporate-network or compliant device. Deprovision within 15 minutes of user offboarding."
- Secrets Rotation CI Job (description):
<strong>Template:</strong> "Rotate DB user 'codex_reporter' password monthly using Vault. After rotation, run connectivity smoke test against all Sites and if success, commit new secret reference to secret manager. If failure, rollback and alert DB and SRE teams."
- Auditor request (logs):
<strong>Template:</strong> "Provide authentication logs, publish history, export events, and connector rotation events for project 'Payments-Dashboard' from 2025-01-01 to 2025-06-01. Include user IDs, timestamps, IP addresses, and action details. Retention required: 3 years."
Expert recommendations
- Operate Sites under the same security governance as other BI tools — do not treat them as a special case. Integrate them into change control, access reviews, and incident response plans.
- Adopt a “least trust” posture: assume compromised endpoints and build controls (device posture checks, short-lived tokens, strict query limits) to reduce blast radius.
- Document all decisions and trade-offs: encryption key ownership, retention windows, and export policies should be codified and reviewed in regular security audits.
Implementing these controls increases the likelihood of safe, compliant adoption of Codex Sites for enterprise dashboards. Security is not a one-time configuration — it is an operational discipline combining strong technical controls, automated processes, and routine human reviews.
Limitations and Workarounds
Codex Sites are powerful for quickly producing interactive dashboards and internal tooling, but they are not a one-size-fits-all replacement for traditional engineering and platform best practices. Recognizing the platform’s constraints early enables you to design robust architectures that combine the speed of Codex with the guarantees of purpose-built services. Below we expand on key limitations, provide detailed workarounds, offer practical prompt templates, and include operational recommendations you can apply immediately.
Limitation: Complex custom backend logic
Codex excels at generating front-end UIs and simple CRUD flows, but scenarios that require complex domain logic—such as multi-step transactional processes, reconciliation between disparate ledgers, batch settlement, or deterministic financial computations—are risky to implement purely in a generated site. These operations demand explicit transaction boundaries, idempotency, audit trails, retries, and often formal verification that a generated system will not provide out of the box.
Workarounds and implementation patterns
- Push complex logic to a dedicated backend: Build the core business logic in a microservice or serverless function (Node.js/Python/Go). Expose narrow, well-documented endpoints that Codex Sites call. This isolates stateful operations and enables unit testing, versioning, and observability.
- Use a lightweight middleware layer: Implement a gateway that enforces business rules, rate-limits, and audit logging. The middleware translates UI intents into safe backend operations and becomes the single place for compliance controls.
- Idempotency and transactional patterns: Require idempotency keys for operations that affect money or inventory. Persist a transaction log in the backend and return deterministic results to the Site for display.
- Prompt template for generating a serverless endpoint:
<!-- Prompt: Generate a serverless Node.js function that accepts POST /reconcile with {requestId, payload}, validates a JWT, enforces idempotency using DynamoDB, runs reconciliation, and returns status -->
Using such a prompt while exporting a Site to a dev environment will save time while preserving the safety of heavyweight operations.
Limitation: Real-time scale and push updates
Codex Sites can be configured to poll or accept webhooks, but they are not optimized for large-scale, ultra-low-latency push streams (e.g., thousands of concurrent clients requiring sub-100ms updates). Native support for persistent sockets and backpressure handling is often limited in no-code/low-code hosted outputs.
Workarounds and pragmatic design choices
- Event broker + buffering: Use a messaging layer such as Google Pub/Sub, AWS SNS/SQS, or a managed WebSocket service to aggregate events. Have a small serverless adapter translate broker events into short-poll responses for Sites that cannot maintain WebSocket connections.
- Design for near-real-time UX: For most dashboards, human users perceive updates as instantaneous when updates land within 1–5 seconds. Target a 1–5s polling interval with smart delta payloads and HTTP caching headers (ETags) to reduce bandwidth.
- SLA guidance: Set UX-level SLOs such as 99.9% availability and 95th-percentile update latency under 500ms for backend endpoints; offer fallback modes with stale data warnings when latency exceeds thresholds.
Limitation: Large-scale exports and PII control
Dashboards that allow bulk exports can create privacy and compliance risks when Personally Identifiable Information (PII) is included. Codex-generated Sites may not include comprehensive access controls or automatic redaction rules for exports.
Workarounds and compliance patterns
- Server-side export generation: Implement export generation in a controlled backend that enforces field-level masking, pseudonymization, and policy checks before writing to a secure storage location (e.g., S3 with encryption-at-rest and limited IAM roles).
- Approval workflows: Disable direct downloads for sensitive roles; require a manual or automated approval workflow that records the approver, purpose, and retention policy for every export.
- Retention and auditing: Automate retention deletion policies and log export activity with immutable logs. For GDPR-like exposure, remember fines can reach up to €20M or 4% of global turnover—so rigorous controls are justified.
Limitation: Design fidelity vs. rapid generation
Codex will generate usable UX components quickly but is not a replacement for brand-driven design systems or accessibility-specific components that require strict conformance (WCAG 2.1 AA, corporate design tokens, etc.).
Workarounds for design and accessibility
- Design tokens + component library: Provide Codex with a style guide or Figma tokens and then apply a branded CSS layer during the export process. Keep a single-source component library (React/Stencil/Web Components) and replace generated components with approved ones as needed.
- QA checklist: Bake an accessibility and visual QA checklist into deployment pipelines: keyboard navigation, color contrast ratios (4.5:1 for normal text), and screen reader labels.
Limitation: Model hallucination in textual suggestions
When Codex proposes suggested messaging, insights, or recommended actions, it may produce content that is fluent but factually incorrect or unsupported by your data. This is particularly risky for customer communication or regulatory statements.
Mitigations and operational controls
- Human-in-the-loop: Always mark automatically generated content as draft and require a human to approve before distribution.
- Evidence linking: Annotate each suggestion with a link to the supporting data row, ticket, or transaction ID. Store provenance metadata in the backend so every message can be traced.
- Prompt template for safe suggestions:
<!-- Prompt: Generate suggested email text in draft form. Include inline citations in brackets referencing dataset rows: [row:12345], and flag any unsupported assertions with "VERIFY". -->
Additional Limitations: Permissions, testing, and third-party APIs
Common additional limitations include coarse-grained role-based access, limited CI/CD/version control for generated Sites, and rate-limit handling for third-party APIs that the Site calls directly.
Practical solutions
- Row-level security: Implement RLS in the backend database or enforce row filters in the middleware. Use JWTs with custom claims such as {“org_id”:”123″,”roles”:[“manager”],”scope”:[“read:orders”]} and validate claims server-side.
- CI and versioning: Export Sites into a Git-backed environment (Replit, GitHub) and adopt PR-based workflows. Tag releases and run automated UI and integration tests against staging endpoints.
- API rate limiting: Use a throttling gateway and exponential backoff in the front-end. Cache third-party responses for a short TTL (example: 30s–5m depending on freshness needs) to reduce calls.
Comparison: Integration strategies
| Approach | Scalability | Latency | Complexity | Security |
|---|---|---|---|---|
| No-code only (pure Codex Site) | Low–Medium | Medium (polling) | Low | Medium (limited controls) |
| Serverless backend | High (auto-scale) | Low–Medium (<200–500ms typical) | Medium | High (IAM, VPC options) |
| Dedicated microservice + broker | Very High | Low (<100ms achievable) | High | Very High (fine-grained controls) |
| Middleware gateway | High | Low–Medium | Medium | High |
Expert recommendations
- Design for failure: implement circuit breakers, retries with exponential backoff, and clear user messaging for degraded modes.
- Instrument everything: use structured logs, distributed traces, and metrics tied to business KPIs (e.g., reconciliation time, export count, approval latency).
- Define SLOs and alert thresholds before rollout; include security and privacy metrics alongside performance.
- Adopt a phased approach: prototype quickly with Codex, then harden critical paths (auth, exports, reconciliation) in code that can be audited and tested.
When you combine the rapid iteration capabilities of Codex Sites with deliberate backend design, observability, and compliance controls, you achieve a pragmatic balance: build fast, but operate safely. Treat Codex as the front door and visualization layer, and keep your high-integrity logic and sensitive controls behind tested, auditable services.
Practical Appendix: Prompt Library and Quick Templates
The following short templates are ready to paste into the “Create Site” prompt field and tailored to your dataset names. They are optimized for non-technical users and include acceptance criteria. Use them as composable building blocks: start with a quick template for prototyping, then apply an annotation/iteration cycle to add transformations, permission rules, and automated tests described below.
How to Use These Templates
Best practice: copy a quick template, substitute your exact dataset/table names and column names, and append explicit acceptance criteria and refresh rules. Each prompt should include:
- Dataset mapping: exact table names and the key columns used for joins (e.g., customer_id, event_ts).
- Role rules: which named roles can view, edit, publish, or export content.
- Acceptance criteria: machine-checkable assertions (CSV headers, row counts, sample value checks).
- Performance constraints: acceptable load times or aggregation windows.
Quick Templates (original + enhanced acceptance)
Revenue Planner (quick)
"Create a Revenue Forecast Planner using tables: bookings, pipeline, subscriptions. Show three scenario tabs (Base, Upside, Downside), KPI cards (Current ARR, Forecast ARR, Churn), a scenario controls panel (ACV modifier, conversion modifier), and export to CSV. Acceptance: exported CSV contains scenario_name and parameters_json. Only Finance role can commit scenarios."
Enhanced prompt additions you can append:
- Include schema mapping: bookings.booking_id, bookings.amount_usd, pipeline.stage, subscriptions.start_date, subscriptions.mrr.
- Acceptance checks: exported CSV contains columns scenario_name, parameters_json, generated_at_iso, total_forecast_arr_usd; scenario changes are audit-logged with user_id and role. Validate sample row: total_forecast_arr_usd for Base scenario within ±2% of precomputed sample value.
- Performance: UI should load KPI cards within 1.5s for datasets up to 250k rows; for larger datasets use pre-aggregated view bookings_monthly by ACV bucket.
Product Launch Hub (quick)
"Create a Launch Hub from launch_milestones and messaging_templates with a Kanban board, messaging preview, and decision register. Lock publish to 'Launch Owner' role and add activity feed for changes."
Practical additions:
- Acceptance: Kanban columns map to milestone_status (planned, in_progress, blocked, done); messaging preview renders markdown from messaging_templates.template_body; publish button only visible to users with role ‘Launch Owner’.
- Export: decisions export includes decision_id, decision_text, decision_date, owner_id.
Customer Review Workspace (quick)
"Create a Customer Review dashboard that aggregates customer_feedback and usage_events. Show top themes, sentiment, suggested fixes, and a prioritized backlog export to JIRA. Acceptance: top theme list matches manual theme extraction in sample sheet."
Notes for quality:
- Data: customer_feedback.comment_text, customer_feedback.submitted_at, usage_events.session_duration.
- Acceptance tests: top_themes must contain the top 5 phrases from sample_feedback.csv using the same stemming rules; sentiment score range -1 to 1 and sample sentiment for ID 12345 equals 0.75 ± 0.05.
- Integration: JIRA export uses CSV columns summary, description, priority, labels and triggers success HTTP 200 on test webhook.
Project Board (quick)
"Create a Project Board wired to sprint_tasks and ci_cd_status with Kanban, burn-down, and pipeline health tile. Warn when resource allocation exceeds 85%."
Implementation tips:
- Define resource allocation calc: sum(estimated_hours * allocation_percent) / capacity_hours. Trigger visual warning when >85% for any resource.
- Acceptance: burn-down matches sprint_tasks.remaining_hours aggregated by day; pipeline health tile shows last 30 build statuses and fail_rate_percent (failures/total_runs).
Event Ops Dashboard (quick)
"Create an Event Ops dashboard using attendees and checkin_logs. Show check-in progress, staffing assignments, and incident form. Include 'Emergency Mode' toggle to focus on incidents only."
Operational details:
- Metrics: checkin_rate = checked_in / registered_total displayed in real-time; staffing_overrides tracked for current shift.
- Acceptance: ‘Emergency Mode’ filters to incident_type != NULL and raises audible_alert flag; incident form submissions persist to incidents table within 3s.
Advanced Templates and Variations
When moving from prototype to production, use advanced prompts that specify data transforms, refresh cadence, and monitoring checks. Below are drop-in advanced variations you can paste and adapt.
Advanced Revenue Planner (production-ready)
"Create a Revenue Forecast Planner using materialized views: bookings_monthly, pipeline_stage_agg, subscriptions_active. Provide scenario tabs (Base/Upside/Downside), KPI cards, ACV and conversion sliders, scenario commit workflow restricted to Finance role, and CSV exports with columns: scenario_name, parameters_json, forecast_date, total_forecast_arr_usd. Refresh bookings_monthly nightly; validate sample totals against internal ledger within 0.5% during CI check."
Multi‑Tenant Customer Review (GDPR-aware)
"Create a Multi‑Tenant Customer Review dashboard using tenant_id-qualified customer_feedback and usage_events. Mask personally identifiable columns (email, phone) for non‑admin roles; provide tenant_owner role full access. Acceptance: anonymized exports replace email with hashed_email and remove IP addresses. Implement retention filter to exclude records older than tenant_policy.retention_days."
Acceptance Criteria, Testing, and Automation
Every template should carry machine-readable acceptance criteria. Treat dashboards like software: include unit-like checks and an automated CI job that validates them after deploy. Recommended checks:
- Schema validation: required columns exist with expected types.
- Sanity checks: key KPIs fall within historical bounds (e.g., churn_rate between 0.0 and 0.2).
- Export verification: CSV headers exactly match spec and row count equals visible rows.
- Permission tests: roles cannot access restricted UI elements or endpoints.
- Performance: initial render of primary KPI panel under X ms (1.5s for small datasets, 3s for medium).
Data and Performance Guidelines
Practical thresholds and recommendations:
| Template Type | Dataset Size Suitable | Recommended Backend | Performance Tips |
|---|---|---|---|
| Quick (prototype) | < 100k rows | Direct SQL / live connector | Use client-side aggregation and caching for tiles; limit default time windows |
| Advanced (production) | 100k–5M rows | Materialized views, cached API endpoints | Pre-aggregate daily metrics, paginate table views |
| Enterprise (high-volume) | >5M rows | Columnar store, OLAP cubes | Use summary tables, backend rollups, asynchronous exports |
Concrete numbers: dashboards with >1M raw event rows should never attempt row-level joins in-browser; precompute joins in the DB or a transformation layer. Aim for KPI tile response times <2s for a good UX; measure using synthetic load tests.
Role & Security Checks
Define role names explicitly in prompts and translate them to your identity provider (IDP) mapping. Example role map:
| Role in Prompt | Typical IDP Group | Capabilities |
|---|---|---|
| Finance | okta:finance_team | commit scenarios, export financial CSVs |
| Launch Owner | gdir:product_launch | publish messages, lock milestones |
| tenant_owner | saml:tenant_admin | view tenant data, manage retention |
Security recommendations:
- Enforce least privilege: default to read-only unless explicitly granted write/publish roles.
- Audit: include immutable audit logs with user_id, role, action, and UTC timestamp for all commits and exports.
- Masking: specify PII masking rules in the prompt so the generated site enforces them at the data layer.
Prompt Variations and Example Snippets
Short prompt fragments you can append to adapt behavior:
- For hourly refresh: “Refresh critical KPI tiles every 1 hour; non-critical charts nightly.”
- For sample-mode: “When user is in demo mode, show only first 1000 rows and remove PII.”
- For analytics: “Log each user interaction to analytics.events with event_name and latency_ms.”
Final Professional Recommendations
Treat these prompts as executable specifications. Invest time in clear acceptance criteria and CI validation—teams that do this reduce rollback rates by over 40% on dashboard releases. Use pre-aggregation and materialized views for production workloads, and codify role mappings to your IDP to avoid manual configuration drift. Finally, maintain a versioned prompt library in your repo so prompts can be reviewed, tested, and audited like code.
Conclusion: Operationalizing Codex Sites in Your Organization
Codex Sites make it possible for non-technical teams to create interactive, shareable enterprise dashboards and lightweight applications rapidly. The most successful deployments follow a disciplined pattern:
- Governance first: enable Sites with clear roles and data access rules.
- Start small with 1–2 high-value Sites (e.g., forecasting and project tracking) and iterate using annotations and short feedback cycles.
- Integrate with your existing design and deployment tooling (Figma, Replit, Vercel) only when required for fidelity or custom logic.
- Operationalize with monitoring, schema mapping layers, and a change management process to keep Sites resilient.
When used thoughtfully, Codex Sites empower business users to reduce time-to-insight and improve cross-functional collaboration without long engineering lead times. This tutorial provided the step-by-step patterns, prompts, governance and security practices, and integration options you need to deliver production-ready Sites that scale across your enterprise.
Operational Details: From Pilot to Production
Moving beyond a pilot requires explicit operational work across four domains: governance, data contracts, observability, and platform enablement. Below are the concrete artifacts you should create and the technical thresholds to manage risk.
- Governance artifacts: role matrix, approval workflow, data access policy, onboarding checklist. A conservative starting point enforces read-only access for business users and limits write-capable Sites to a small change-controlled group.
- Data contracts: publish schema manifests (name, type, cardinality, example values) and implement automatic schema contracts that run during deploy. Use contract tests to detect breaking changes before they reach Sites.
- Observability: log user events, query latencies, error rates, and data freshness. Aggregate and visualize these in a central dashboard; set automated alerts when latency > 500ms or data age exceeds SLA.
- Platform enablement: create templates for commonly used Sites (forecast, tracker, KPI wall) and provide a one-click provisioning path that seeds folders, permissions, and test data.
Practical Pilot KPIs and Targets
Define measurable targets for a 30–90 day pilot. Use these recommended KPIs and threshold targets to judge success and decide whether to scale:
| KPI | Recommended Target (Pilot) | Why it matters |
|---|---|---|
| Active users (weekly) | 10–25% of target cohort within 30 days | Early adoption shows value and surfaces UX gaps |
| Time-to-insight | 30–50% reduction versus manual reports | Measures operational efficiency gains |
| Query latency (95th percentile) | < 500ms for interactive widgets | Responsive UX keeps adoption high |
| Data freshness SLA | Defined per use case (e.g., 15 minutes for ops, daily for HR) | Ensures trust in decisions made from Sites |
| Escalations / incidents | < 1 per week for pilot | Indicates system stability and quality of integrations |
Prompt Templates and Example Workflows
Below are practical prompt templates you can use with Codex or internal assistants to accelerate development, enforce standards, and onboard new Site creators.
Template: Generate a Site Spec from a One-Line Requirement
Use this to convert stakeholder requests into an actionable Site specification.
"Requirement: 'Create a weekly revenue forecast dashboard by region with drilldowns to product.'
Produce:
- Page components (filters, charts, table, export button)
- Required data sources and suggested SQL views
- Expected row-level security rules
- Acceptance tests (UI + data checks)"
Template: Schema Manifest Generator
Automatically produce a JSON/CSV manifest for schema mapping and contract testing.
"Input: sample query or table name
Output: CSV with columns: field_name, data_type, example_value, nullable, cardinality, pii_flag, recommended_masking"
Template: Audit-Ready Access Grant
Create an auditable request for access that can be routed to approvers and attached to deploys.
"User: [name], Team: [team], Site: [site_id], Data_scope: [tables], Level: read/write
Include justification, business owner sign-off, and retention period."
Use Cases and Concrete Examples
Codex Sites shine in scenarios where rapid iteration, embedded calculations, and user-driven exploration are required. Examples:
- Revenue planning: a finance team builds a forecast Site with scenario toggles (price, volume, churn) and shares it with sales for rapid negotiation modeling. Typical result: forecast cycle compresses from 7 days to 2 days in pilots.
- Project portfolio tracker: PMOs create a single Site that aggregates status across tools (Jira API, time entries), enabling weekly reviews without manual consolidation.
- Inventory optimization: supply chain teams combine demand forecasts and lead-time variability in a Site to produce reorder recommendations, reducing stockouts in pilots by 15–30%.
- Incident command board: operations teams publish a Site that surfaces live alerts, runbooks, and postmortem notes with role-based edit controls for incident leads.
Security, Compliance, and Cost Controls
Security and cost controls are not optional. Implement these minimum controls before broad rollout:
- Enforce SSO and MFA integration for all creators and viewers.
- Apply row-level security (RLS) on datasets and offer masked views for PII-sensitive fields.
- Limit export capabilities according to policy—allow CSV exports only for approved roles and log every export.
- Monitor API usage and set quotas; track spend per workspace and implement auto-alerts at 70% and 90% of budget.
Testing and Change Management
Treat Sites like software. Use the following checklist to maintain quality as usage increases:
- Unit tests for any embedded transformation logic and widget render tests for major browser families.
- Integration tests validating upstream data freshness and end-to-end user journeys (login, filter, drilldown, export).
- Contract tests to validate schema changes—fail CI if a contract-breaking change is detected.
- Change advisory board (CAB) or automated approvals for Sites that connect to sensitive data or change compute costs materially.
Comparing Options: When to Use Codex Sites
The table below helps decide when Codex Sites are the right tool versus alternatives like embedded BI or a full custom app.
| Characteristic | Codex Sites | Embedded BI | Custom App |
|---|---|---|---|
| Time-to-value | Hours–days | Days–weeks | Weeks–months |
| Customization depth | Moderate (custom logic supported) | Low–Moderate | High |
| Maintenance overhead | Low (managed) | Medium | High |
| Compliance controls | High (with governance) | Medium | Very High (requires engineering) |
Expert Recommendations
- Start with templates and a small Centre of Excellence to maintain standards while enabling broad self-service.
- Measure both quantitative and qualitative outcomes—pair usage stats with a short user survey after two weeks of live usage.
- Prefer read-only Sites until a pattern of trust and automated testing exists; then enable write/update capabilities under stricter controls.
- Automate schema detection and manifest generation to reduce errors and accelerate onboarding for new data sources.
- Budget for ongoing training: regular office hours, example repositories, and short video walkthroughs reduce support load significantly.
If you want a one-page checklist to run a Codex Sites pilot in 30 days, consider the following milestones:
| Week | Milestone | Key Deliverable |
|---|---|---|
| Week 1 | Enable Sites and provision roles | Workspace enabled, roles defined, pilot teams selected |
| Week 2 | Build 1st Site (Revenue Planner) | Published Site, test dataset connected, exports validated |
| Week 3 | Iterate and add security controls | Annotations applied, SSO access configured, logging enabled |
| Week 4 | Roll out to extended users and monitor | Usage metrics instrumented and first feedback cycle completed |
Delivering enterprise dashboards with Codex Sites requires a balance of rapid iteration and disciplined governance. Apply the prompts, integration patterns, and security controls in this guide to accelerate your time-to-value while maintaining control and compliance.
Author: Markos Symeonides
Related Articles on ChatGPT AI Hub
Explore more in-depth guides and tutorials from our library to deepen your understanding:
- GPT-5.3 Codex: Revolutionizing Software Development ( Part 1 of 7 )
- How to Build and Schedule AI Coding Workflows with Claude Code Routines
- Inside Stargate: How OpenAI Is Building the $500 Billion Compute Foundation for AGI
- The 2026 AI Coding Tools Showdown: Codex, Claude Code, Cursor, Copilot, and Gemini CLI Compared
- How to Use OpenAI Codex with Chrome DevTools: A Complete Developer Guide for 2026
Useful Links and Resources
- OpenAI Codex Official Page — The official product page for OpenAI Codex with latest updates and documentation.
- OpenAI API Documentation — Complete developer documentation for all OpenAI APIs and models.
- ChatGPT — Access ChatGPT with GPT-5.5 capabilities directly from OpenAI.
- OpenAI GitHub — Open-source tools, libraries, and example code from OpenAI.
- OpenAI Blog — Latest announcements, research papers, and product updates.
- OpenAI Community Forum — Community discussions, tips, and troubleshooting.
Stay Ahead of the AI Curve
Get exclusive tutorials, breaking news, and expert prompts delivered to your inbox every week. Join 15,000+ AI professionals.