The GPT-5.5 Prompts Masterclass for Data Science: EDA, Feature Engineering, and Model Evaluation

The GPT-5.5 Prompts Masterclass for Data Science: EDA, Feature Engineering, and Model Evaluation
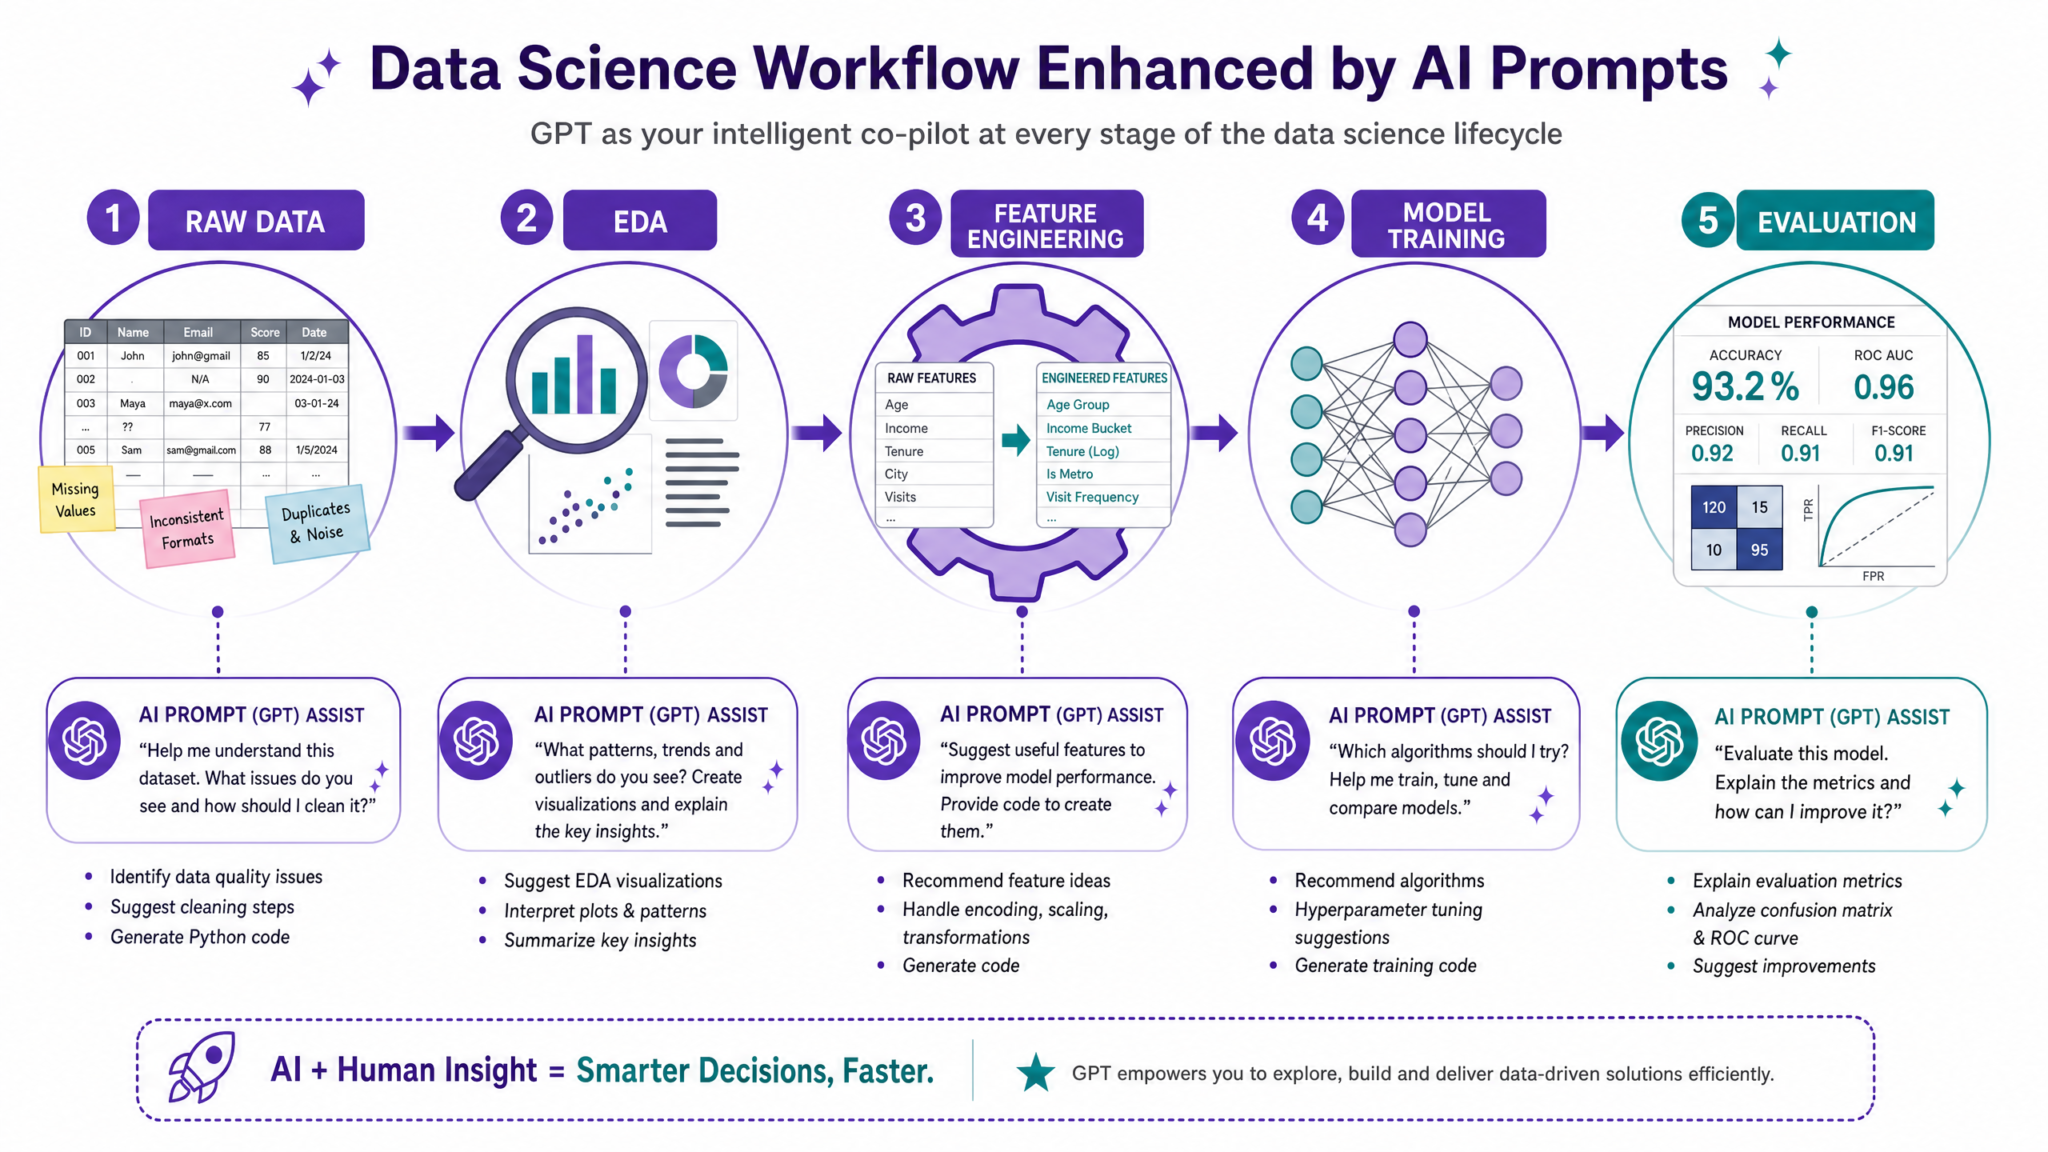
In today’s data-driven landscape, the integration of advanced artificial intelligence models such as GPT-5.5 into the data science workflow is no longer a futuristic concept but an essential practice. The exponential growth in data volume, complexity, and velocity necessitates innovative tools that not only expedite routine tasks but also enhance the depth and quality of insights derived from data. GPT-5.5, with its unparalleled natural language understanding and generation capabilities, serves as a transformative asset for data scientists aiming to optimize their processes — from Exploratory Data Analysis (EDA) to feature engineering, data cleaning, and model evaluation.
The Strategic Value of GPT-5.5 in Data Science
GPT-5.5 transcends traditional programming paradigms by enabling conversational, context-aware interactions with data science workflows. Unlike conventional scripting, where every step requires explicit coding, GPT-5.5 can interpret high-level instructions, generate analytical code snippets, suggest innovative feature transformations, and even critique model performance metrics in natural language. This flexibility allows data scientists to:
- Accelerate Prototyping: Quickly generate and iterate on EDA visualizations and statistical summaries without writing repetitive code.
- Enhance Analytical Rigor: Receive suggestions for advanced statistical tests, anomaly detection methods, or feature selection techniques grounded in best practices.
- Automate Tedious Tasks: Delegate routine data cleaning operations, such as handling missing values or encoding categorical variables, through precisely crafted prompts.
- Improve Collaboration: Generate clear, interpretable explanations of model results and data insights that facilitate cross-functional communication.
Key Components of GPT-5.5 Prompt Engineering for Data Science
To fully harness GPT-5.5’s potential, it is critical to develop a nuanced understanding of prompt engineering — the artful construction of input queries that guide the model to produce accurate, relevant, and actionable outputs. Effective prompt engineering for data science involves several core elements:
1. Contextual Framing
Providing GPT-5.5 with comprehensive context about the dataset, project goals, and data science phase is essential. For example, a prompt that begins with:
“Given a dataset containing customer transaction records with features such as purchase amount, date, and product category, perform an exploratory data analysis highlighting key trends and anomalies.”
is significantly more effective than a vague prompt like “Analyze this data.” The former sets clear expectations and guides the model’s response towards actionable EDA insights.
2. Instruction Specificity
Explicit instructions reduce ambiguity. For instance, rather than asking GPT-5.5 to “clean the data,” specify:
- Which columns require cleaning (e.g., “Handle missing values in the ‘Age’ and ‘Income’ columns”).
- The preferred methods (e.g., “Use median imputation for numerical columns and mode imputation for categorical variables”).
- Any domain-specific considerations (e.g., “Ensure that age values below 0 are flagged and corrected”).
3. Iterative Refinement
Prompt engineering is an iterative process. Initial outputs should be reviewed critically, and prompts refined accordingly. For example:
Initial Prompt: "Generate features from the dataset."
Refined Prompt: "Create polynomial features up to degree 3 for numerical columns ‘Age’ and ‘Income’ and encode categorical variables using one-hot encoding."
This refinement directs GPT-5.5 to produce more tailored and technically precise outputs.
Examples of GPT-5.5 Prompts Tailored to Data Science Phases
| Data Science Phase | Example Prompt | Expected Model Output |
|---|---|---|
| Exploratory Data Analysis (EDA) |
“Summarize the distribution and correlation of features in the sales dataset, including visualizations like histograms and heatmaps.” |
Python code generating summary statistics, matplotlib/seaborn visualizations, and interpretation of feature relationships. |
| Feature Engineering |
“Based on the transaction data, create interaction terms between ‘Product Category’ and ‘Region’, and normalize continuous variables using Min-Max scaling.” |
Code snippets for creating new interaction features and applying Min-Max scaling, with explanations of their impact on model performance. |
| Data Cleaning |
“Identify and impute missing values in the customer demographics dataset, using median for numerical and mode for categorical variables.” |
Data cleaning pipeline including detection of missing data, imputation logic, and validation steps. |
| Model Evaluation |
“Evaluate the classification model’s performance using accuracy, precision, recall, F1-score, and ROC-AUC, and provide a detailed interpretation of these metrics.” |
Code to compute evaluation metrics, plots such as ROC curves, and a comprehensive explanation of model strengths and weaknesses. |
Best Practices for Integrating GPT-5.5 into Data Science Pipelines
To maximize GPT-5.5’s value, consider the following best practices when embedding prompt-driven AI assistance into your data science projects:
- Modular Prompt Design: Break down complex tasks into smaller, manageable prompts. For example, separate EDA into descriptive statistics, visualization, and outlier detection prompts.
- Version Control Prompts and Outputs: Maintain a repository of prompts and their generated code outputs to ensure reproducibility and facilitate auditing.
- Human-in-the-Loop Validation: Always review GPT-5.5 outputs critically—automated code generation can accelerate workflows but requires domain expertise to validate assumptions and results.
- Custom Prompt Templates: Develop reusable prompt templates tailored to your organization’s typical datasets and analytical objectives to standardize workflows.
- Security and Privacy Considerations: When working with sensitive data, ensure prompts do not expose confidential information, and comply with data governance policies.
Advanced Techniques: Leveraging GPT-5.5 for Analytical Creativity
Beyond routine automation, GPT-5.5 can act as a creative partner in data science. For instance:
- Hypothesis Generation: Ask GPT-5.5 to propose testable hypotheses based on preliminary data trends, accelerating the scientific inquiry process.
- Feature Selection Recommendations: Obtain suggestions for domain-relevant feature selection techniques, such as Recursive Feature Elimination (RFE) or Principal Component Analysis (PCA), tailored to your dataset characteristics.
- Model Interpretation Support: Generate accessible explanations for complex model behaviors, aiding communication with non-technical stakeholders.
By cultivating expertise in prompt engineering and understanding GPT-5.5’s capabilities and limitations, data scientists can dramatically enhance their analytical workflows. This masterclass serves as a comprehensive guide to systematically unlock the full potential of GPT-5.5 for every critical phase of the data science lifecycle.
1. Introduction to GPT-5.5 Prompt Engineering for Data Science
GPT-5.5 represents a transformative advancement in the field of natural language processing (NLP), delivering unparalleled capabilities in understanding and generating human-like text with remarkable precision. Its enhanced contextual awareness and domain-specific adaptability make it an indispensable tool for data scientists aiming to streamline and elevate their workflow. Unlike previous iterations, GPT-5.5 excels at interpreting complex data science concepts and translating them into actionable insights, code snippets, and analytical narratives that are both accurate and contextually relevant.
The Power of Prompt Engineering in Data Science
At the heart of harnessing GPT-5.5’s potential lies the art and science of prompt engineering. This process involves meticulously crafting input queries to guide the model towards producing outputs that align with specific data science tasks, such as exploratory data analysis (EDA), feature engineering, and model evaluation. The efficacy of GPT-5.5’s responses is highly sensitive to how prompts are designed; thus, mastering prompt engineering is critical for maximizing productivity and insight generation.
Core Principles of Effective GPT-5.5 Prompt Engineering
To fully leverage GPT-5.5 in data science applications, prompts must adhere to several foundational principles that ensure comprehensiveness, relevance, and clarity:
- Context-Aware: Prompts should embed detailed information about the dataset, including variable names, data types, underlying distributions, and the specific objectives of the analysis. For example, specifying whether the data involves time series, categorical variables, or missing values allows GPT-5.5 to tailor its output appropriately.
- Stepwise: Breaking down complex analytical questions into smaller, logically ordered sub-questions helps the model provide structured and coherent responses. This iterative prompting technique reduces ambiguity and enhances the interpretability of generated content.
- Code-Focused: Explicitly requesting Python code snippets within the prompt encourages GPT-5.5 to produce immediately executable scripts, fostering seamless integration into data science pipelines. This approach accelerates experimentation and prototyping.
- Analytically Rigorous: Prompts should encourage the model to go beyond surface-level answers by providing detailed statistical explanations, justifications for chosen methods, and potential caveats. This rigor ensures that outputs are not only practical but also scientifically sound.
Detailed Example: Structuring a Prompt for EDA
Consider a dataset containing customer demographics and transaction history for an e-commerce platform. A well-engineered prompt for GPT-5.5 to perform EDA might look like this:
"Given the dataset with columns: 'customer_id' (int), 'age' (int), 'gender' (categorical: Male/Female), 'annual_income' (float), 'purchase_count' (int), and 'last_purchase_date' (datetime), please perform an exploratory data analysis. Provide:- A summary of data types and missing values per column.
- Descriptive statistics including mean, median, standard deviation for numerical variables.
- Distribution plots suggestions for ‘age’ and ‘annual_income’ with corresponding Python code using matplotlib or seaborn.
- Identification of potential outliers and suggestions on how to handle them.
- Insights on correlations between variables, including a correlation matrix and heatmap code.
This prompt is comprehensive, guiding GPT-5.5 to deliver a multi-faceted EDA output, complete with interpretive commentary and executable code.
Why Context Matters: Embedding Dataset Schema and Analysis Goals
Embedding explicit dataset schemas and analysis objectives within prompts enables GPT-5.5 to tailor its responses with precision. For example, specifying that the task involves predictive modeling for customer churn versus a purely descriptive analysis will influence the nature of feature suggestions and evaluation metrics the model prioritizes.
Additionally, incorporating domain-specific terminology or constraints—such as regulatory considerations in healthcare data or seasonality in retail sales—enables GPT-5.5 to generate outputs that respect these nuances, minimizing the need for extensive post-processing or corrections.
Table: Elements of a Context-Rich Prompt
| Element | Description | Example |
|---|---|---|
| Dataset Schema | Detailed description of column names, data types, and sample values. | “Columns: ‘age’ (int), ‘gender’ (categorical: Male/Female), ‘income’ (float)” |
| Analysis Objective | Specifies the purpose of the task (e.g., EDA, feature creation, model evaluation). | “Perform exploratory data analysis focusing on identifying outliers and feature distributions.” |
| Constraints | Any domain-specific restrictions or considerations. | “Ensure compliance with GDPR data privacy standards.” |
| Preferred Tools | Specifies libraries or coding conventions to use. | “Provide Python code using pandas and seaborn.” |
Stepwise Prompting for Complex Data Science Tasks
Complex data science projects often involve multiple interconnected stages, such as cleaning, transformation, modeling, and evaluation. GPT-5.5’s performance improves significantly when prompts are structured to address each stage incrementally rather than requesting a holistic solution in a single prompt.
For instance, a prompt sequence for feature engineering might be:
- Step 1: “Analyze the distribution and missingness of variables in the dataset.”
- Step 2: “Suggest feature transformations to handle skewed distributions or categorical encoding.”
- Step 3: “Generate Python code snippets for the proposed feature engineering steps.”
- Step 4: “Explain the rationale behind each transformation in terms of model performance and interpretability.”
This modular approach not only makes GPT-5.5’s outputs easier to validate but also facilitates iterative refinement based on intermediate results.
Code-Focused Prompts: Accelerating Practical Application
One of GPT-5.5’s standout features is its ability to generate high-quality, executable Python code tailored to specific data science tasks. Prompting the model to produce code snippets alongside analytical narratives bridges the gap between theory and practice, enabling data scientists to quickly prototype and test ideas.
Consider this example prompt:
"Provide a Python function using pandas and matplotlib that takes a DataFrame and generates a summary report including missing value counts, descriptive statistics, and histograms for numerical columns."
The model will respond with well-documented, reusable code, accelerating exploratory workflows and reducing manual coding errors.
Encouraging Analytical Rigor: Beyond Surface-Level Outputs
GPT-5.5’s capacity for detailed explanations and methodological reasoning can be unlocked by guiding prompts to request:
- Statistical justifications for techniques used (e.g., why log-transform a skewed variable).
- Interpretations of model evaluation metrics (e.g., explaining precision, recall, F1-score in classification).
- Potential limitations and assumptions inherent in suggested methods.
This analytical rigor ensures that GPT-5.5 acts not just as a code generator, but as a knowledgeable collaborator, enhancing the quality and trustworthiness of data science outputs.
Summary
Mastering GPT-5.5 for data science hinges on the deliberate design of prompts that are contextually rich, logically structured, code-oriented, and analytically deep. This foundation sets the stage for leveraging the model’s advanced capabilities to automate and enhance key stages of data science workflows, including EDA, feature engineering, and model evaluation.
In the following section, we will explore how to apply these prompt engineering principles specifically to Exploratory Data Analysis (EDA), showcasing detailed examples, best practices, and practical code demonstrations.
2. Mastering Exploratory Data Analysis (EDA) with GPT-5.5
2.1 Crafting EDA Prompts for Comprehensive Insights
Exploratory Data Analysis (EDA) serves as the critical first step in any data science workflow, providing a thorough understanding of the dataset’s characteristics, revealing underlying patterns, detecting anomalies, and informing subsequent modeling decisions. Mastering EDA with GPT-5.5 involves formulating prompts that clearly communicate the dataset’s structure, the statistical analyses required, and the types of visualizations desired. The goal is to leverage GPT-5.5’s advanced reasoning and coding capabilities to generate robust, reproducible Python scripts that streamline the EDA process.
Key Elements to Include in EDA Prompts
- Dataset schema and data types: Explicitly list all columns and their data types (e.g., integer, float, categorical, datetime, list) to ensure GPT-5.5 understands variable characteristics.
- Statistical summaries: Specify the types of descriptive statistics required, including measures of central tendency (mean, median, mode), dispersion (variance, standard deviation, interquartile range), and distribution shape (skewness, kurtosis).
- Visualizations: Detail the preferred plots such as histograms, boxplots, count plots, scatterplots, or heatmaps to visualize distributions, relationships, and data quality issues.
- Data quality checks: Request identification of missing values, outliers, duplicates, and suggestions for imputation or cleaning strategies.
- Explanatory comments: Ask for well-commented code with concise explanations to facilitate understanding and knowledge transfer.
Below is a refined and extensible EDA prompt template designed to extract comprehensive exploratory analysis from GPT-5.5:
Prompt:
"I have a dataset with the following columns and data types:
- 'age' (integer),
- 'income' (float),
- 'gender' (categorical: 'Male', 'Female'),
- 'purchase_history' (list of integers).

Please generate a detailed Python script using pandas, matplotlib, and seaborn that performs the following:

1. Calculate summary statistics for numerical variables, including mean, median, mode, variance, standard deviation, skewness, and kurtosis.
2. Generate distribution plots (histograms with KDE overlays, boxplots) for 'age' and 'income'.
3. Create count plots for the 'gender' categorical variable.
4. Compute and visualize a correlation matrix heatmap for numerical columns.
5. Detect missing values, outliers (using IQR method), and duplicates; provide suggestions for imputation or cleaning strategies.
6. Include detailed comments explaining each step and a brief textual summary of findings after each analysis block."
Example GPT-5.5 Generated Python Script
Upon submitting the above prompt, GPT-5.5 typically produces structured, modular Python code similar to the example below. This code leverages core libraries pandas, matplotlib, and seaborn to execute a systematic EDA workflow:
import pandas as pd
import matplotlib.pyplot as plt
import seaborn as sns
from scipy import stats

# Load dataset
df = pd.read_csv('your_dataset.csv')

# 1. Summary statistics for numerical variables
print("Summary Statistics for 'age' and 'income':")
print(df[['age', 'income']].describe())

print("\\nMode for 'age' and 'income':")
print(df[['age', 'income']].mode())

print("\\nSkewness and Kurtosis:")
print(df[['age', 'income']].agg(['skew', 'kurtosis']))

# 2. Distribution plots
plt.figure(figsize=(14,6))

# Histogram and KDE for 'age'
plt.subplot(1,2,1)
sns.histplot(df['age'], kde=True, bins=30, color='skyblue')
plt.title('Age Distribution with KDE')
plt.xlabel('Age')
plt.ylabel('Frequency')

# Boxplot for 'income'
plt.subplot(1,2,2)
sns.boxplot(x=df['income'], color='lightgreen')
plt.title('Income Boxplot')
plt.xlabel('Income')

plt.tight_layout()
plt.show()

# 3. Count plot for 'gender'
plt.figure(figsize=(6,4))
sns.countplot(x='gender', data=df, palette='pastel')
plt.title('Gender Count')
plt.xlabel('Gender')
plt.ylabel('Count')
plt.show()

# 4. Correlation matrix heatmap for numerical columns
corr = df[['age', 'income']].corr()
plt.figure(figsize=(6,4))
sns.heatmap(corr, annot=True, cmap='coolwarm', vmin=-1, vmax=1)
plt.title('Correlation Matrix')
plt.show()

# 5. Data quality checks

# Missing values
missing = df.isnull().sum()
print("Missing values per column:")
print(missing)

# Outlier detection using IQR for numerical columns
print("\\nOutlier detection using IQR method:")
for col in ['age', 'income']:
    Q1 = df[col].quantile(0.25)
    Q3 = df[col].quantile(0.75)
    IQR = Q3 - Q1
    lower_bound = Q1 - 1.5 * IQR
    upper_bound = Q3 + 1.5 * IQR
    outliers = df[(df[col] < lower_bound) | (df[col] > upper_bound)]
    print(f"{col}: {len(outliers)} outliers detected")

# Duplicate rows check
duplicates = df.duplicated().sum()
print(f"Number of duplicate rows: {duplicates}")

# Imputation suggestions
print("\\nImputation and cleaning suggestions:")
for col in df.columns:
    if missing[col] > 0:
        if df[col].dtype == 'object':
            print(f"- For '{col}': Impute missing values with the mode (most frequent category).")
        else:
            print(f"- For '{col}': Impute missing values with median or mean depending on skewness.")
if duplicates > 0:
    print("- Consider removing duplicate rows to maintain data integrity.")
Analytical Depth and Interpretability
This generated script not only automates common EDA tasks but also incorporates advanced statistical measures such as skewness and kurtosis, which help assess the symmetry and tail heaviness of distributions—crucial for choosing transformations later. The outlier detection using the Interquartile Range (IQR) method is a robust approach for flagging anomalous data points that may skew model training. Additionally, explicit imputation recommendations provide practical guidance on data cleaning strategies.
Extending EDA Prompts for Complex Data Types and Scenarios
Datasets often include more complex or domain-specific variables such as datetime, geospatial data, or nested lists (e.g., purchase_history as a list of integers). To effectively analyze these, prompts can be extended as follows:
- Datetime variables: Request extraction of temporal features like year, month, weekday, and generation of time series plots.
- Text or categorical lists: Ask for frequency distribution analysis, word clouds, or aggregation of list elements.
- Handling Imbalanced Classes: For classification problems, prompt GPT-5.5 to compute class distribution and suggest resampling techniques if imbalance is detected.
Example extension snippet:
Prompt addition:
"Additionally, analyze the 'purchase_history' list column by computing the average number of purchases per customer and the frequency distribution of purchase counts. Also, identify if the dataset contains imbalanced classes in 'gender' and suggest resampling methods if imbalance exceeds 10%."
2.2 Best Practices for EDA Prompt Design
Designing effective prompts for GPT-5.5 to perform EDA requires strategic clarity and completeness. Below are the best practices distilled from extensive experimentation and usage:
- Explicitly Specify Data Types and Variable Context: GPT-5.5’s responses are more accurate when it understands the nature of each variable. Include data types, value ranges, and categorical levels whenever possible.
- Request Both Code and Explanatory Commentary: Asking for inline comments and post-analysis summaries improves the interpretability and educational value of generated scripts, supporting easier validation and knowledge sharing among teams.
- Emphasize Visualization Generation: Visual representations like histograms, boxplots, scatterplots, and heatmaps are indispensable for intuitive understanding. Clearly state which plots are required and their purposes.
- Include Data Quality Checks: Prompt for systematic identification of missing values, outliers, and duplicates, along with practical cleaning recommendations. This ensures data integrity before modeling.
- Encourage Modularity and Reusability: Request code structured in functions or logical blocks to facilitate reuse and extension in larger pipelines.
- Address Domain-Specific Requirements: Tailor prompts to include domain knowledge, such as handling temporal features in time series data or categorical encoding in NLP datasets.
Sample Prompt Structure Checklist
| Prompt Element | Purpose | Example |
|---|---|---|
| Dataset columns and data types | Clarify variable characteristics | ‘age’ (integer), ‘income’ (float), ‘gender’ (categorical) |
| Desired summary statistics | Specify numerical measures | Mean, median, mode, variance, skewness |
| Visualizations | Define plot types for analysis | Histogram with KDE, boxplot, correlation heatmap |
| Data quality checks | Identify missing values, outliers, duplicates | Report count and suggest imputation |
| Code comments and explanations | Enhance readability and teaching | Include step-wise comments and summaries |
By adhering to these guidelines, data scientists can maximize the value extracted from GPT-5.5’s capabilities, accelerating their exploratory workflows and ensuring analytical rigor.
For advanced exploratory techniques including multivariate analysis, see to optimize prompt structures and analytic depth.
3. Feature Engineering: Unlocking Predictive Power
3.1 Prompting for Automated Feature Creation
Feature engineering is a critical step in the data science pipeline that involves transforming raw data into informative, predictive features that enhance model performance. With GPT-5.5, data scientists can leverage sophisticated prompt engineering to automate the generation of domain-aware feature transformations, interaction terms, and encoding techniques tailored to specific datasets. This not only accelerates the feature creation process but also introduces nuanced insights that might be overlooked in manual workflows.
Detailed Example: Domain-Specific Feature Generation
Consider a dataset containing the columns age, income, gender, and purchase_history, where purchase_history is a list of purchase amounts per customer. A well-crafted prompt to GPT-5.5 could be:
Prompt:
"Given a dataset with columns 'age', 'income', 'gender', and 'purchase_history',
generate Python code to create the following features:
- Age buckets (e.g., 18-25, 26-35, etc.)
- Log transformation of 'income' to reduce skewness
- One-hot encoding for 'gender'
- Aggregated features from 'purchase_history' such as total purchases and average purchase value.

Explain why each feature is useful for predictive modeling."
GPT-5.5 can output a comprehensive Python script using pandas and numpy, exemplified below:
import pandas as pd
import numpy as np

# Assume df is the original DataFrame

# 1. Age buckets: Categorize age into meaningful groups to capture non-linear effects
bins = [17, 25, 35, 45, 55, 65, 100]
labels = ['18-25', '26-35', '36-45', '46-55', '56-65', '65+']
df['age_bucket'] = pd.cut(df['age'], bins=bins, labels=labels)

# 2. Log transform income to reduce right skewness and stabilize variance
df['log_income'] = np.log1p(df['income'])

# 3. One-hot encoding for gender to convert categorical variables into numeric format without ordinal assumptions
df = pd.get_dummies(df, columns=['gender'], drop_first=True)

# 4. Aggregate purchase_history features to summarize purchasing behavior
df['total_purchases'] = df['purchase_history'].apply(sum)
df['avg_purchase'] = df['purchase_history'].apply(lambda x: np.mean(x) if len(x) > 0 else 0)

# Explanation:
# - Age buckets facilitate capturing age-related behavioral patterns that are non-linear.
# - Log transformation of income helps models better handle skewed distributions.
# - One-hot encoding ensures the categorical gender variable is effectively used in algorithms that require numeric inputs.
# - Aggregated purchase features compress transactional data into meaningful predictors reflecting customer engagement.
Why These Features Matter
- Age Buckets: Instead of treating age as a continuous variable, bucketing captures demographic segments, enabling models to learn segment-specific effects.
- Log Income: Income data often exhibits a heavy tail; applying a log transform reduces skewness, improves normality, and helps linear models perform better.
- One-Hot Encoding for Gender: Machine learning models typically require numeric inputs; one-hot encoding translates categorical variables without imposing ordinal relationships.
- Purchase History Aggregations: Raw purchase sequences are high-dimensional and sparse. Summarizing these into total and average metrics condenses customer behavior into digestible, predictive statistics.
3.2 Advanced Feature Engineering Prompts
While basic transformations are essential, unlocking the full predictive potential of your dataset often requires advanced feature engineering techniques. GPT-5.5 excels at generating complex feature sets when guided by detailed, domain-informed prompts. This section explores how to construct prompts that lead to sophisticated feature generation, including polynomial features, interaction terms, time-based features, and dimensionality reduction.
3.2.1 Polynomial and Interaction Features
Polynomial features allow models to capture non-linear relationships by including powers of numeric variables. Interaction terms represent combined effects of two or more features, which can reveal synergistic influences on the target variable.
Example Prompt:
Prompt:
"Generate Python code to create polynomial features up to degree 3 for 'age' and 'income',
and interaction terms between 'age_bucket' and 'gender'.
Use appropriate encoding and scaling techniques for model readiness."
Key GPT-5.5 outputs might include code utilizing PolynomialFeatures from sklearn.preprocessing and careful encoding of categorical variables before interactions:
from sklearn.preprocessing import PolynomialFeatures
from sklearn.preprocessing import OneHotEncoder
from sklearn.compose import ColumnTransformer
from sklearn.pipeline import Pipeline
import pandas as pd
import numpy as np

# Numerical features
num_features = ['age', 'income']

# Categorical features
cat_features = ['age_bucket', 'gender']

# Polynomial features for numeric variables
poly = PolynomialFeatures(degree=3, include_bias=False)
df_poly = pd.DataFrame(poly.fit_transform(df[num_features]),
                       columns=poly.get_feature_names_out(num_features))

# One-hot encode categorical features for interaction terms
ohe = OneHotEncoder(drop='first', sparse=False)
cat_encoded = pd.DataFrame(ohe.fit_transform(df[cat_features]),
                           columns=ohe.get_feature_names_out(cat_features))

# Concatenate all features
df_final = pd.concat([df, df_poly, cat_encoded], axis=1)

# Create interaction terms between 'age_bucket' and 'gender' encoded columns
for age_col in cat_encoded.filter(regex='age_bucket').columns:
    for gender_col in cat_encoded.filter(regex='gender').columns:
        df_final[f'{age_col}_x_{gender_col}'] = df_final[age_col] * df_final[gender_col]
3.2.2 Time-Based Features
When datasets include temporal information, extracting time-based features such as trends, seasonality, lags, and rolling statistics can dramatically improve model accuracy, especially in time series or event-driven data contexts.
Example Prompt:
Prompt:
"Given a dataset with a 'transaction_date' column in datetime format,
generate Python code to:
- Extract day of week, month, and quarter
- Compute rolling averages of 'purchase_amount' over 7 and 30 days
- Create lag features for 'purchase_amount' up to 3 previous transactions."
df['transaction_date'] = pd.to_datetime(df['transaction_date'])

# Extract date-based features
df['day_of_week'] = df['transaction_date'].dt.dayofweek
df['month'] = df['transaction_date'].dt.month
df['quarter'] = df['transaction_date'].dt.quarter

# Sort data by customer and date if applicable
df = df.sort_values(['customer_id', 'transaction_date'])

# Rolling averages (7-day and 30-day windows)
df['rolling_avg_7d'] = df.groupby('customer_id')['purchase_amount'].transform(lambda x: x.rolling(window=7, min_periods=1).mean())
df['rolling_avg_30d'] = df.groupby('customer_id')['purchase_amount'].transform(lambda x: x.rolling(window=30, min_periods=1).mean())

# Lag features (previous 3 purchase amounts)
for lag in range(1, 4):
    df[f'lag_{lag}'] = df.groupby('customer_id')['purchase_amount'].shift(lag)
3.2.3 Dimensionality Reduction and Feature Selection
High-dimensional feature spaces can lead to overfitting, increased computational cost, and interpretability challenges. GPT-5.5 can help by generating code for dimensionality reduction techniques like Principal Component Analysis (PCA) or feature selection algorithms such as Recursive Feature Elimination (RFE) and SelectKBest.
Example Prompt:
Prompt:
"Provide Python code to perform PCA on numeric features to reduce dimensionality to 5 components,
and implement Recursive Feature Elimination with a Random Forest estimator to select the top 10 features."
from sklearn.decomposition import PCA
from sklearn.feature_selection import RFE
from sklearn.ensemble import RandomForestClassifier

# Assume numeric_features is a list of numeric columns
numeric_features = ['age', 'income', 'log_income', 'total_purchases', 'avg_purchase', ...]  # extend as necessary

# PCA for dimensionality reduction
pca = PCA(n_components=5)
pca_components = pca.fit_transform(df[numeric_features])
pca_df = pd.DataFrame(pca_components, columns=[f'PCA_{i+1}' for i in range(5)])
df = pd.concat([df, pca_df], axis=1)

# Recursive Feature Elimination with Random Forest
X = df.drop(columns=['target'])  # Replace 'target' with actual target column
y = df['target']

rfe_selector = RFE(estimator=RandomForestClassifier(n_estimators=100, random_state=42), n_features_to_select=10, step=1)
rfe_selector = rfe_selector.fit(X, y)

selected_features = X.columns[rfe_selector.support_]
print("Selected Features:", list(selected_features))
3.3 Best Practices for Crafting Feature Engineering Prompts
To maximize GPT-5.5’s efficacy in feature engineering, consider the following strategies:
- Be Explicit and Contextual: Clearly specify the dataset schema, feature types, and domain context to guide GPT-5.5 in generating relevant transformations.
- Request Explanations: Ask for rationale behind each generated feature to ensure interpretability and validate domain relevance.
- Iterative Refinement: Use multi-turn prompting to refine features, for example by asking GPT-5.5 to optimize or prune generated features based on model feedback.
- Integrate with Pipelines: Prompt for code that fits into scalable pipelines using libraries like
scikit-learn‘sPipelineandColumnTransformerfor reproducibility and maintenance.
3.4 Integrating Feature Engineering into Modeling Pipelines
Efficient feature engineering should seamlessly integrate with model training and evaluation workflows. GPT-5.5 can generate modular code snippets that fit within pipeline architectures, enabling automated, reproducible transformations. For a comprehensive guide on building robust feature engineering pipelines in Python, consult .
| Technique | Description | Predictive Benefit | Example Use Cases |
|---|---|---|---|
| Age Bucketing | Grouping continuous age into discrete intervals | Captures non-linear demographic effects | Customer segmentation, churn prediction |
| Log Transformation | Applies logarithm to skewed numeric features | Reduces skewness, stabilizes variance | Income, sales amounts, time durations |
| One-Hot Encoding | Converts categorical variables to binary columns | Enables use of categorical data in numeric models | Gender, region, product categories |
| Aggregate Purchase Features | Summarizes transactional data into statistics | Condenses complex behavior into key metrics | Customer lifetime value, fraud detection |
| Polynomial & Interaction Terms | Creates higher-order and combined features | Models complex, non-linear relationships | Credit scoring, risk modeling |
| Time-Based Features | Extracts temporal patterns from timestamps | Captures seasonality and trend effects | Sales forecasting, anomaly detection |
| Dimensionality Reduction (PCA) | Transforms features to fewer components | Reduces overfitting and computational load | Image processing, genomics data |
| Feature Selection (RFE) | Iteratively selects most predictive features | Improves model interpretability and accuracy | High-dimensional datasets, text data |
4. Data Cleaning and Imputation Strategies Using GPT-5.5
4. Data Cleaning and Imputation Strategies Using GPT-5.5
4.1 Designing Prompts to Detect and Correct Data Quality Issues
Data cleaning is a foundational pillar in building reliable and performant machine learning models, particularly in data science workflows involving exploratory data analysis (EDA), feature engineering, and model evaluation. GPT-5.5, with its advanced natural language understanding and code generation capabilities, serves as a powerful assistant to automate and standardize these tedious yet critical tasks.
When crafting prompts to detect and correct data quality issues, clarity, specificity, and context are paramount. A well-structured prompt enables GPT-5.5 to generate comprehensive and robust Python scripts that follow best practices in data cleaning. Below is an exemplar prompt that encapsulates multiple common data quality challenges:
Prompt:
"Generate Python code that identifies and:
- Removes duplicate rows.
- Fills missing numerical values using median imputation.
- Fills missing categorical values using the most frequent category.
- Detects and caps outliers in 'income' using the IQR method.
- Validates data types and corrects inconsistencies.

Explain the rationale behind each cleaning step."
The resulting code addresses each task methodically with explanations embedded as comments:
import pandas as pd
import numpy as np

# Remove duplicate rows to prevent biased model training
df = df.drop_duplicates()

# Identify numerical columns for median imputation
num_cols = df.select_dtypes(include=['float64', 'int64']).columns
for col in num_cols:
    median_val = df[col].median()
    df[col].fillna(median_val, inplace=True)

# Identify categorical columns for mode imputation
cat_cols = df.select_dtypes(include=['object', 'category']).columns
for col in cat_cols:
    mode_val = df[col].mode()[0]
    df[col].fillna(mode_val, inplace=True)

# Outlier detection and capping in 'income' using IQR
Q1 = df['income'].quantile(0.25)
Q3 = df['income'].quantile(0.75)
IQR = Q3 - Q1
lower_bound = Q1 - 1.5 * IQR
upper_bound = Q3 + 1.5 * IQR

df['income'] = np.where(df['income'] < lower_bound, lower_bound, df['income'])
df['income'] = np.where(df['income'] > upper_bound, upper_bound, df['income'])

# Validate and convert data types to ensure consistency
df['age'] = df['age'].astype(int)
# Additional type corrections can be added as needed

# Explanation:
# - Removing duplicates avoids biased model training caused by data repetition.
# - Median imputation is robust to skewed distributions and outliers for numerical data.
# - Mode imputation preserves the most common category in missing categorical data.
# - IQR capping constrains outliers without removing data points, preserving information.
# - Correct data types prevent downstream processing errors and enhance computational efficiency.
Detailed Breakdown of Cleaning Steps
| Step | Description | Why It Matters | Common Pitfalls |
|---|---|---|---|
| Duplicate Removal | Eliminates repeated rows that may skew analysis and model learning. | Prevents model bias and inaccurate performance metrics. | Overzealous removal might drop legitimate repeated observations; verify domain context. |
| Median Imputation (Numerical) | Replaces missing values with the median to maintain central tendency. | Robust against skewed data and extreme values. | Avoids using mean when data is non-normally distributed. |
| Mode Imputation (Categorical) | Fills missing categories with the most frequent value. | Preserves categorical distribution and reduces class imbalance. | May introduce bias if the mode is overly dominant. |
| Outlier Detection & Capping | Identifies extreme values using Interquartile Range (IQR) and caps them. | Mitigates undue influence of outliers on models sensitive to scale. | Capping may distort data if outliers contain valuable information. |
| Data Type Validation | Ensures all columns have appropriate data types for analysis and modeling. | Prevents runtime errors and improves memory usage. | Incorrect conversions can lead to data loss or misinterpretation. |
Advanced Prompt Engineering Tips for Data Cleaning
- Explicitly Define Column Names and Data Types: Specify which columns require special handling to avoid ambiguity.
- Include Domain Knowledge: Incorporate rules relevant to your dataset, such as valid ranges or category mappings.
- Request Explanations: Asking GPT-5.5 to explain each step fosters better understanding and maintainability.
- Iterative Refinement: Use multi-turn prompting to refine cleaning code based on intermediate outputs and errors.
- Incorporate Validation Checks: Have GPT-5.5 generate assertions or summary statistics to verify cleaning effectiveness.
Example: Prompt for Dataset-Specific Cleaning
Prompt:
"Generate a Python script to clean the sales dataset with these requirements:
- Remove rows where 'transaction_date' is missing or invalid.
- Convert 'transaction_date' to datetime format, correcting common errors.
- Standardize 'product_category' values based on the provided mapping dictionary.
- Fill missing 'sales_amount' by linear interpolation.
- Detect and handle outliers in 'sales_amount' using z-score thresholding with threshold=3.
- Provide summary statistics before and after cleaning."
This prompt guides GPT-5.5 to produce a targeted cleaning workflow that addresses domain-specific challenges, such as date parsing and categorical standardization, which are often neglected in generic cleaning scripts.
4.2 Leveraging GPT-5.5 for Custom Cleaning Tasks
Generic cleaning approaches are often insufficient for complex or domain-specific datasets. GPT-5.5’s contextual awareness and adaptability make it an invaluable tool for creating tailored cleaning solutions that incorporate unique business rules, data dictionaries, and domain semantics.
Integrating Domain Knowledge and Data Dictionaries
By embedding references to data dictionaries or metadata into prompts, GPT-5.5 can generate cleaning logic that respects the semantics of each feature. For example, prompts can instruct the model to:
- Verify categorical values against allowed lists and flag invalid entries.
- Correct common misspellings or inconsistent naming conventions.
- Normalize date/time formats and handle timezone inconsistencies.
- Apply domain-specific thresholds or transformation rules.
Example prompt snippet:
Prompt:
"Using the provided data dictionary, generate code that:
- Validates 'region' against ['North', 'South', 'East', 'West'] and replaces invalid entries with 'Unknown'.
- Parses 'event_timestamp' with multiple possible formats and converts to UTC.
- Applies log transformation on 'sales_volume' only if values are positive."
Handling Complex Missing Data Patterns
Real-world datasets often exhibit complex missingness patterns, such as missing not at random (MNAR) or systematic gaps. GPT-5.5 can generate nuanced imputation strategies that go beyond simple median or mode replacements, including:
- Conditional imputation based on correlated features.
- Predictive imputation using lightweight models.
- Flagging imputed values with indicator variables for downstream awareness.
Integrating Data Cleaning into Automated Pipelines
To ensure reproducibility and scalability, data cleaning tasks should be embedded within automated ETL (Extract, Transform, Load) pipelines. GPT-5.5 can assist in generating modular, reusable cleaning functions or classes compatible with popular pipeline frameworks like Airflow, Luigi, or Prefect.
Additionally, GPT-5.5 can help draft comprehensive unit tests and validation scripts to monitor data quality continuously.
For practical guidance on embedding AI-assisted cleaning workflows within production pipelines, explore Automated Data Cleaning with AI.
5. Model Evaluation and Interpretation: Prompting GPT-5.5 for Robust Analysis
5. Model Evaluation and Interpretation: Prompting GPT-5.5 for Robust Analysis
5.1 Generating Comprehensive Evaluation Metrics and Visualizations
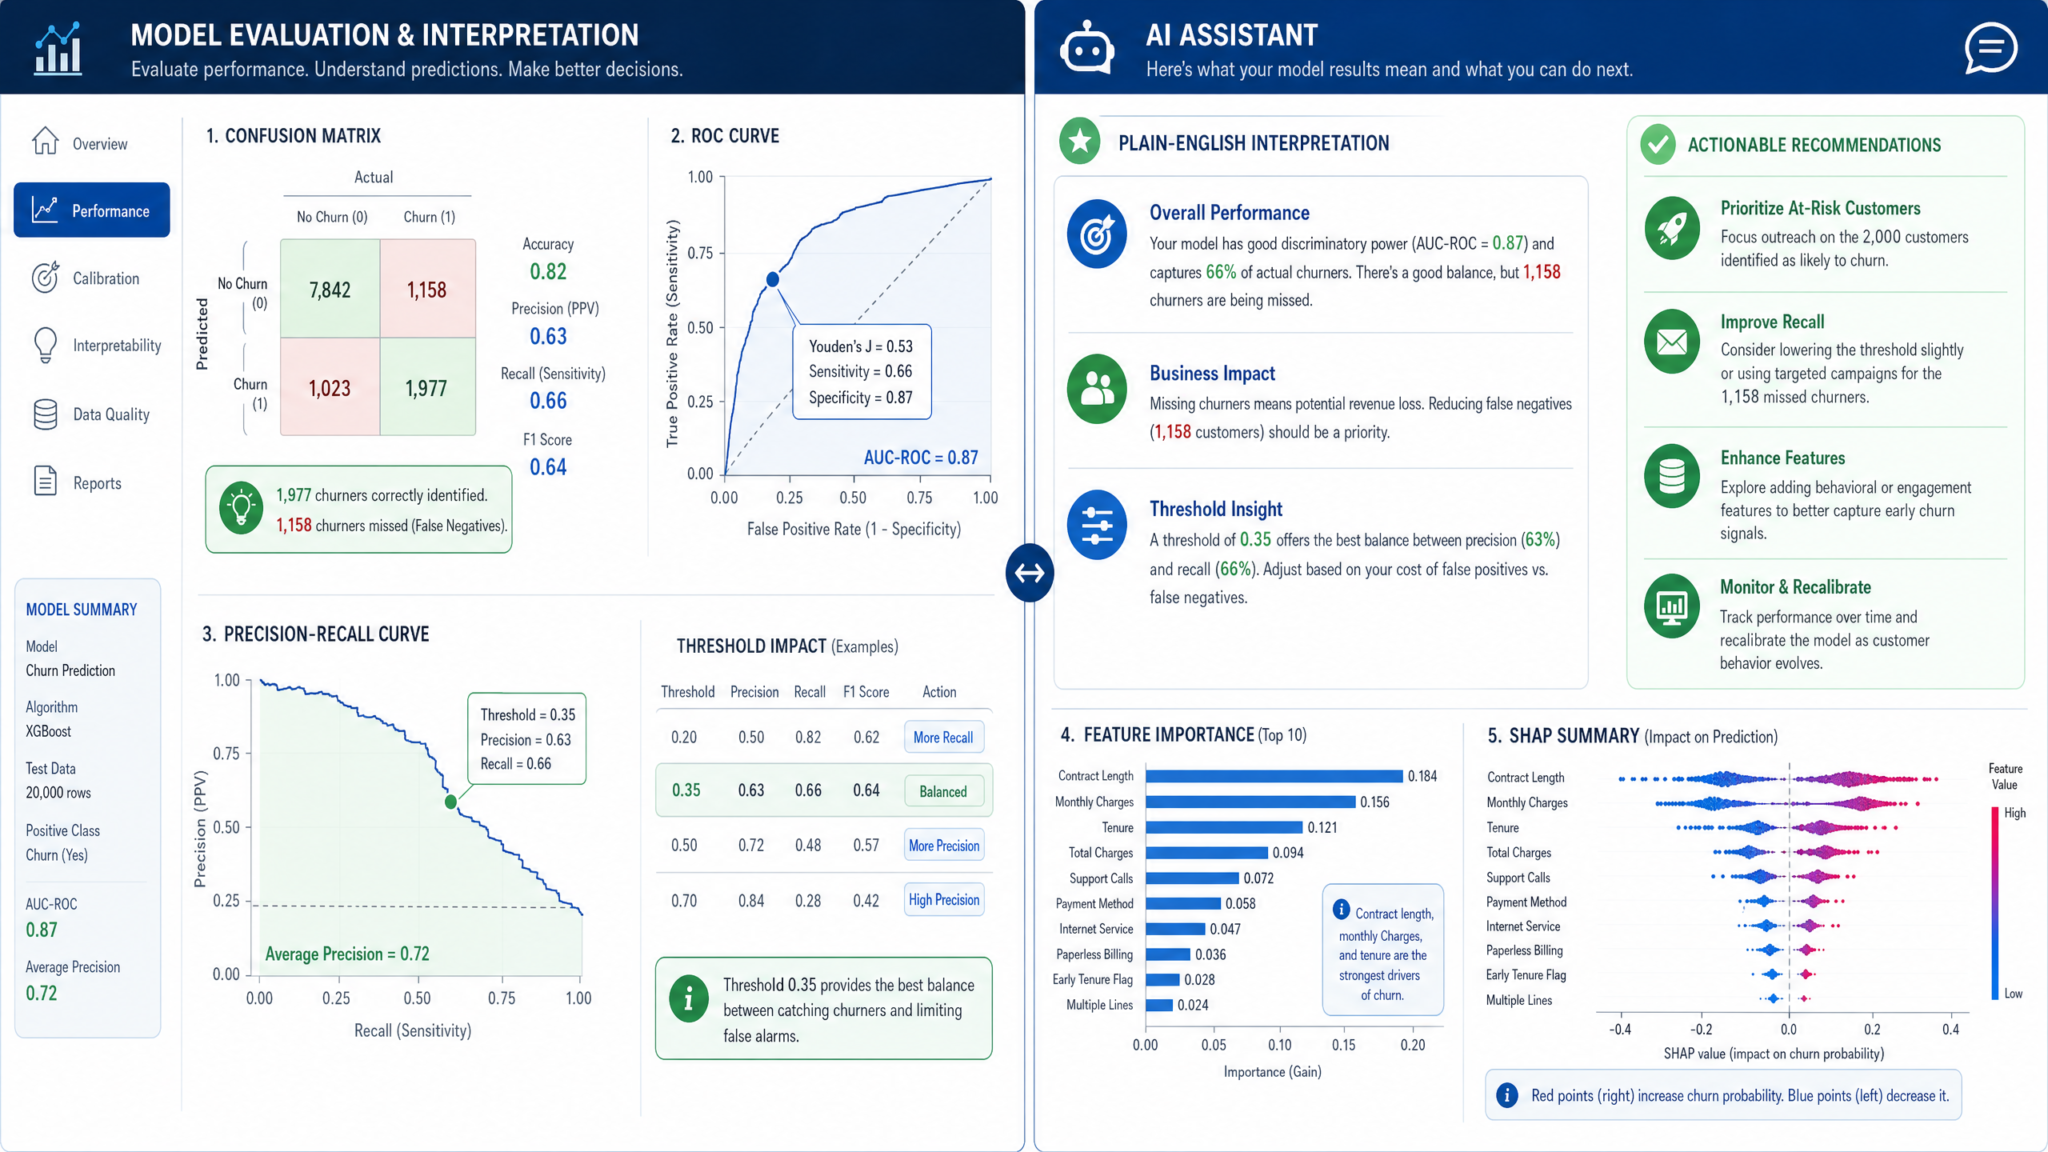
Robust evaluation of machine learning models is a cornerstone of effective data science workflows. It ensures that predictive models not only perform well on training data but also generalize effectively to unseen data, mitigating risks such as overfitting or underfitting. GPT-5.5 excels at generating detailed, reproducible evaluation scripts that encompass a broad spectrum of metrics and visual diagnostics, enabling practitioners to conduct rigorous performance assessments with ease.
When prompting GPT-5.5 for evaluation code, it is critical to specify the context, model type, and desired output comprehensively. Consider the example prompt below, designed for a binary classification task:
Prompt:
"Given a trained binary classification model and test data, generate Python code that:
- Computes accuracy, precision, recall, F1 score, and AUC.
- Plots the ROC curve and confusion matrix.
- Includes additional metrics such as Matthews Correlation Coefficient (MCC) and Cohen's Kappa.
- Provides detailed textual interpretation for each metric.
- Uses scikit-learn, matplotlib, and seaborn libraries.
- Includes handling for imbalanced classes."
This prompt guides GPT-5.5 to produce a holistic evaluation script that not only calculates standard metrics but also integrates advanced indicators suited for imbalanced datasets, a common challenge in real-world data science projects.
from sklearn.metrics import (
    accuracy_score, precision_score, recall_score, f1_score,
    roc_auc_score, roc_curve, confusion_matrix, matthews_corrcoef, cohen_kappa_score
)
import matplotlib.pyplot as plt
import seaborn as sns

# Generate predictions and predicted probabilities
y_pred = model.predict(X_test)
y_prob = model.predict_proba(X_test)[:, 1]

# Calculate evaluation metrics
acc = accuracy_score(y_test, y_pred)
prec = precision_score(y_test, y_pred)
rec = recall_score(y_test, y_pred)
f1 = f1_score(y_test, y_pred)
auc = roc_auc_score(y_test, y_prob)
mcc = matthews_corrcoef(y_test, y_pred)
kappa = cohen_kappa_score(y_test, y_pred)

# Print metrics with detailed interpretation
print(f"Accuracy: {acc:.3f} - Overall proportion of correctly classified instances.")
print(f"Precision: {prec:.3f} - Among predicted positives, the fraction that are true positives.")
print(f"Recall (Sensitivity): {rec:.3f} - Among actual positives, the fraction correctly identified.")
print(f"F1 Score: {f1:.3f} - Harmonic mean of precision and recall, useful for imbalanced classes.")
print(f"AUC (Area Under ROC Curve): {auc:.3f} - Model's ability to distinguish between classes.")
print(f"Matthews Correlation Coefficient (MCC): {mcc:.3f} - Balanced measure accounting for all confusion matrix categories.")
print(f"Cohen's Kappa: {kappa:.3f} - Agreement measure corrected for chance.")

# Plot ROC Curve
fpr, tpr, _ = roc_curve(y_test, y_prob)
plt.figure(figsize=(8, 6))
plt.plot(fpr, tpr, label=f'ROC curve (AUC = {auc:.3f})', linewidth=2)
plt.plot([0, 1], [0, 1], 'k--', label='Random Chance')
plt.xlabel('False Positive Rate')
plt.ylabel('True Positive Rate')
plt.title('Receiver Operating Characteristic (ROC) Curve')
plt.legend(loc='lower right')
plt.grid(True)
plt.show()

# Plot Confusion Matrix with annotations
cm = confusion_matrix(y_test, y_pred)
plt.figure(figsize=(6, 5))
sns.heatmap(cm, annot=True, fmt='d', cmap='Blues', cbar=False)
plt.title('Confusion Matrix')
plt.xlabel('Predicted Label')
plt.ylabel('True Label')
plt.show()
Key Evaluation Metrics Explained
| Metric | Formula / Computation | Interpretation | Use Case / Importance |
|---|---|---|---|
| Accuracy | (TP + TN) / (TP + TN + FP + FN) | Proportion of total correct predictions. | General measure; can be misleading with imbalanced classes. |
| Precision | TP / (TP + FP) | How many predicted positives are actual positives. | Crucial when false positives are costly. |
| Recall (Sensitivity) | TP / (TP + FN) | How many actual positives are correctly identified. | Important when missing positives is costly. |
| F1 Score | 2 × (Precision × Recall) / (Precision + Recall) | Balance between precision and recall. | Useful for imbalanced datasets. |
| AUC (ROC) | Area under ROC curve plotting TPR vs. FPR | Probability model ranks a random positive higher than a negative. | Threshold-independent metric for discrimination ability. |
| Matthews Correlation Coefficient (MCC) | Correlation coefficient between observed and predicted binary classifications. | Balanced metric considering all confusion matrix quadrants. | Effective for imbalanced and balanced datasets. |
| Cohen’s Kappa | Agreement metric correcting for chance agreement. | Measures classification reliability beyond random chance. | Useful in multi-class and imbalanced settings. |
Best Practices for Visualization Prompts
- Specify Visualization Style: Request use of libraries like
seabornfor enhanced aesthetics and readability. - Include Annotations: Ask for detailed labels, titles, legends, and gridlines to improve interpretability.
- Handle Class Imbalance: Request additional plots such as Precision-Recall curves or class distribution bar charts.
- Customize Plot Dimensions: Define figure sizes for publication-quality outputs.
- Save Figures: Include commands to save plots as high-resolution images for reports or dashboards.
Example Prompt for Multi-Class Evaluation
Prompt:
"Generate Python code to evaluate a multi-class classification model with:
- Overall accuracy, macro and weighted precision, recall, and F1 scores.
- Confusion matrix heatmap with class labels.
- Per-class ROC curves using one-vs-rest approach.
- Interpretations for each metric.
- Use scikit-learn, matplotlib, and seaborn."
This approach demonstrates GPT-5.5’s flexibility in adapting to more complex classification scenarios, providing nuanced insights across multiple classes.
5.2 Interpretability and Reporting: Crafting Human-Readable Model Evaluation Narratives
While quantitative metrics and visualizations inform on model performance, effective communication of these results is equally critical. GPT-5.5 can be prompted to generate comprehensive, human-readable evaluation reports that contextualize findings, discuss metric trade-offs, identify potential pitfalls such as overfitting, and recommend next steps for model refinement.
Consider the following advanced prompt designed to elicit detailed, interpretative summaries suitable for stakeholder presentations or technical documentation:
Prompt:
"Create a detailed model evaluation report based on the following metrics: accuracy, precision, recall, F1 score, AUC, MCC, and Cohen's Kappa.
- Explain the significance of each metric.
- Discuss possible trade-offs between precision and recall.
- Identify signs of overfitting or underfitting based on metric patterns.
- Suggest strategies for model improvement, such as hyperparameter tuning or feature engineering.
- Write in a clear, professional tone suitable for data science stakeholders."
GPT-5.5 might produce a structured, insightful narrative such as:
Model Evaluation Report:
The model achieved an accuracy of 0.89, indicating a high overall rate of correct predictions. Precision (0.85) and recall (0.80) reveal that while the model is effective at identifying positive cases, there is a slight tendency to miss some true positives, as indicated by the lower recall. The F1 score of 0.82 balances these metrics, reflecting a moderate trade-off between false positives and false negatives.
The AUC value of 0.91 demonstrates excellent discriminative ability, suggesting the model distinguishes well between classes across various classification thresholds.
The Matthews Correlation Coefficient (0.78) and Cohen’s Kappa (0.75) confirm strong agreement and balanced performance, even accounting for class imbalance.
Potential overfitting signs include a large discrepancy between training and test set performance or high variance in cross-validation scores, which should be examined further.
To improve the model, consider hyperparameter tuning using grid or random search, incorporating additional feature engineering steps such as polynomial features or interaction terms, and applying regularization techniques to reduce overfitting.
Structured Reporting: Key Elements to Include
- Summary of Metrics: Concise overview with numerical values and interpretive context.
- Trade-offs Analysis: Discussion of precision vs. recall, sensitivity vs. specificity, or other relevant balances.
- Overfitting/Underfitting Diagnostics: Identification based on metric trends and validation results.
- Improvement Recommendations: Actionable next steps, including model tuning, data augmentation, or feature selection.
- Visual Aids Integration: Embedding references to plots or tables that support textual explanations.
Additional Prompting Strategies for Automated Evaluation Reporting
- Multi-Lingual Reports: Request output in different languages for international teams.
- Audience-Specific Language: Tailor explanations for technical experts, business stakeholders, or non-technical audiences.
- Incorporate Benchmarking: Compare model performance against baseline or previous versions.
- Explainability Integration: Include SHAP or LIME summaries to elucidate feature impacts.
- Dynamic Report Generation: Automate generation of Markdown or HTML reports for seamless integration into project documentation workflows.
For a deep dive into comprehensive evaluation methodologies, including cross-validation strategies, hyperparameter optimization, and best practices for metric selection, refer to .
6. Summary and Best Practices for GPT-5.5 Prompt Engineering in Data Science
6. Summary and Best Practices for GPT-5.5 Prompt Engineering in Data Science
This masterclass has meticulously dissected the sophisticated craft of designing high-impact prompts tailored for GPT-5.5, enabling data scientists to effectively automate, augment, and accelerate critical analytical workflows. Through detailed explorations spanning exploratory data analysis (EDA), domain-specific feature engineering, robust data cleaning routines, and comprehensive model evaluation reporting, we have demonstrated how GPT-5.5, when guided by precision-engineered prompts, becomes an indispensable collaborator in the data science lifecycle.
Comprehensive Recap of Core Insights
To consolidate the knowledge imparted, we revisit the fundamental principles and strategies that underpin successful GPT-5.5 prompt engineering for data science applications. These key takeaways are crafted to serve as a practical checklist for practitioners aiming to maximize the model’s utility and ensure outputs that are not only syntactically correct but also contextually relevant and analytically sound.
| Best Practice | Description | Example |
|---|---|---|
| Explicit Clarity and Detail | Define dataset schemas, analytical objectives, and intended steps with precise language. This reduces ambiguity and guides GPT-5.5 towards generating pertinent and accurate code or explanations. |
“Given a dataset with columns: 'age' (int), 'income' (float), and 'purchase_history' (list of strings), write a Python script to perform univariate analysis focusing on income distribution.” |
| Stepwise and Modular Instructions | Decompose complex workflows into distinct, manageable subtasks. This modular approach enables GPT-5.5 to produce clean, reusable code snippets and reduces the risk of conceptual overload. |
“Step 1: Clean missing values in the 'income' column. Step 2: Encode categorical variables using one-hot encoding. Step 3: Generate summary statistics for each feature.” |
| Requesting Explanations and Context | Encourage GPT-5.5 to accompany generated code with inline comments and interpretive summaries. This practice deepens understanding, making outputs more transparent and easier to validate or modify. |
“Include comments explaining the rationale behind each transformation step and provide a summary of expected output.” |
| Iterative Prompt Refinement | Use GPT-5.5’s initial outputs as drafts or prototypes. Iteratively refine prompts by incorporating feedback, clarifying ambiguities, or specifying additional constraints to enhance output quality. |
“After initial code generation, ask GPT-5.5 to optimize for computational efficiency or to handle edge cases such as missing or inconsistent data entries.” |
Deep Dive: Why These Practices Matter
Explicit Clarity and Detail: GPT-5.5’s understanding is shaped primarily by the prompt context. Ambiguous or under-specified instructions often lead to generic or irrelevant outputs. For instance, specifying column data types and the objective (e.g., detecting outliers, generating visualization scripts) allows the model to tailor its responses precisely, avoiding costly trial-and-error cycles.
Stepwise Instructions: Complex operations such as feature engineering or model evaluation encompass multiple logical stages. By breaking them down, the model is better able to maintain logical coherence and avoid conflating tasks. This approach also facilitates code modularity, enabling practitioners to integrate or adapt generated snippets seamlessly into larger projects.
Requesting Explanations: Beyond code generation, GPT-5.5’s ability to provide human-readable explanations is invaluable for documentation, debugging, and knowledge transfer. Encouraging the model to comment its code and summarize outcomes bridges the gap between automated assistance and human interpretability, fostering trust and collaboration.
Iterative Refinement: No prompt is perfect on the first attempt. By treating GPT-5.5’s outputs as living drafts, data scientists can iteratively tune prompt language, add contextual information, or specify performance criteria, progressively enhancing the relevance, accuracy, and efficiency of generated artifacts.
Practical Framework for Crafting Effective GPT-5.5 Prompts
To operationalize these best practices, consider the following step-by-step framework when authoring prompts for data science tasks:
- Define the Data Context: Clearly describe dataset schema, variable types, and any domain-specific characteristics.
- Specify the Analytical Goal: Articulate the desired outcome, e.g., “Identify multicollinearity among features” or “Generate a detailed classification report with ROC curve plots.”
- Break Down Tasks: Divide the overall goal into sequential steps, requesting code or explanations for each.
- Include Constraints and Preferences: Mention libraries, coding style, performance considerations, or specific evaluation metrics.
- Request Explanations: Ask for inline comments, variable descriptions, or summary narratives.
- Iterate and Refine: Review outputs critically, then adjust prompt details or scope to improve relevance and clarity.
Example: Crafting a Prompt for Automated Feature Engineering
Below is an example prompt that embodies these principles, aimed at generating domain-aware feature engineering code for a retail dataset:
Given a retail transaction dataset with columns:
- 'customer_id' (string)
- 'transaction_date' (datetime)
- 'product_category' (categorical)
- 'purchase_amount' (float)

Step 1: Generate features capturing customer purchase frequency and average spend per product category over the last 6 months.
Step 2: Create lag features representing purchase amount trends over the last 3 transactions.
Step 3: Encode categorical variables using target encoding.
Include detailed comments explaining each feature’s purpose and expected impact on sales prediction models.
This prompt explicitly defines the dataset and goals, structures the task into logical steps, and requests interpretive comments, exemplifying best practices for GPT-5.5 prompt engineering.
Advanced Tips for Maximizing GPT-5.5’s Potential
- Leverage Contextual Memory: When possible, provide relevant prior conversation history or data summaries to enrich GPT-5.5’s contextual understanding.
- Use Examples within Prompts: Embed small code snippets or sample data rows to anchor the model’s generation style and content.
- Specify Output Formats: Request outputs in structured formats like JSON, markdown tables, or well-commented Python scripts to facilitate downstream integration.
- Incorporate Domain Terminology: Use precise domain-specific language to signal your expertise and guide GPT-5.5’s responses towards relevant analytical paradigms.
- Set Constraints for Scalability: When working with large datasets or complex models, indicate computational or memory constraints to prompt efficient code generation.
Common Pitfalls and How to Avoid Them
| Pitfall | Consequence | Mitigation Strategy |
|---|---|---|
| Vague or incomplete dataset description | Model generates generic or incorrect code that does not align with data structure. | Include explicit schema details and sample data snippets in the prompt. |
| Overloading prompt with too many tasks | Confused or fragmented outputs that are difficult to parse or integrate. | Break tasks into smaller prompts or use stepwise instructions. |
| Omitting explanation requests | Generated code lacks comments or rationale, hindering comprehension and maintainability. | Explicitly ask for inline comments and summary explanations. |
| Ignoring iterative refinement | Missed opportunity to improve output quality and alignment with project needs. | Adopt a prompt tuning workflow with incremental adjustments and validations. |
Integrating GPT-5.5 into Your Data Science Workflow
GPT-5.5 is not a replacement for human expertise but a powerful augmentation tool. Successful integration involves blending model-generated outputs with domain knowledge, critical thinking, and rigorous validation. Consider the following tips for embedding GPT-5.5 seamlessly into your daily practice:
- Use GPT-5.5 as a Pair Programmer: Treat the model’s outputs as drafts or suggestions rather than final products. Review, test, and adapt accordingly.
- Maintain Version Control: Store prompt versions and generated code snippets in repositories with clear documentation to track evolution and facilitate collaboration.
- Establish Validation Protocols: Always validate generated code on test datasets to ensure correctness and robustness.
- Educate Your Team: Share best practices and prompt templates within your team to accelerate onboarding and maintain quality standards.
- Leverage Community Resources: Participate in forums and knowledge-sharing platforms such as ChatGPT AI Hub to stay updated on emerging prompt engineering techniques and innovations.
As you continue to explore and experiment with GPT-5.5, remember that prompt engineering is both an art and a science — requiring iterative learning, creativity, and disciplined methodology. By adhering to these comprehensive best practices, you will harness GPT-5.5’s full potential to elevate your data science projects, drive productivity, and unlock novel analytical insights.
For ongoing learning and advanced methodologies, explore our dedicated resources and community insights at ChatGPT AI Hub.
📚 Related Articles
🚀 Stay Ahead with AI
Get the latest ChatGPT tips, prompts, and tutorials delivered to your inbox weekly.